The National Survey of Student Engagement (NSSE) is an annual survey that assesses the extent to which undergraduate first-year and senior students engage in educational practices associated with high levels of learning and development. The survey is based on the premise that the frequency with which students engage in effective educational practices indicates the quality of the educational experience.
Overall, 530 institutions of higher education across Canada and the United States participated in NSSE during the spring of 2016, with 333,888 students responding to the survey. Each individual item was compared to the average of all US institutions participating in NSSE for Spring 2016 to determine significant differences (most of which are traditional, campus-based colleges or universities). A total of 11,144 University of Arizona Global Campus students (first year/freshmen and graduating seniors) were invited to participate in the 2016 NSSE, with 2,236 responding.
The University of Arizona Global Campus has categorized each survey item into one of our eight Institutional Outcomes. Selected items that are applicable to our student population are included, with explanations of initiatives to address them. Comparisons between the University of Arizona Global Campus and NSSE 2016 (national comparison group) results are included in this section.
General satisfaction
In terms of general satisfaction, the University of Arizona Global Campus student ratings are significantly higher than national averages in the areas of quality of academic advising, overall educational experience, and likelihood to attend the same university again, given the opportunity to start over.
See General Satisfaction tab below.
-
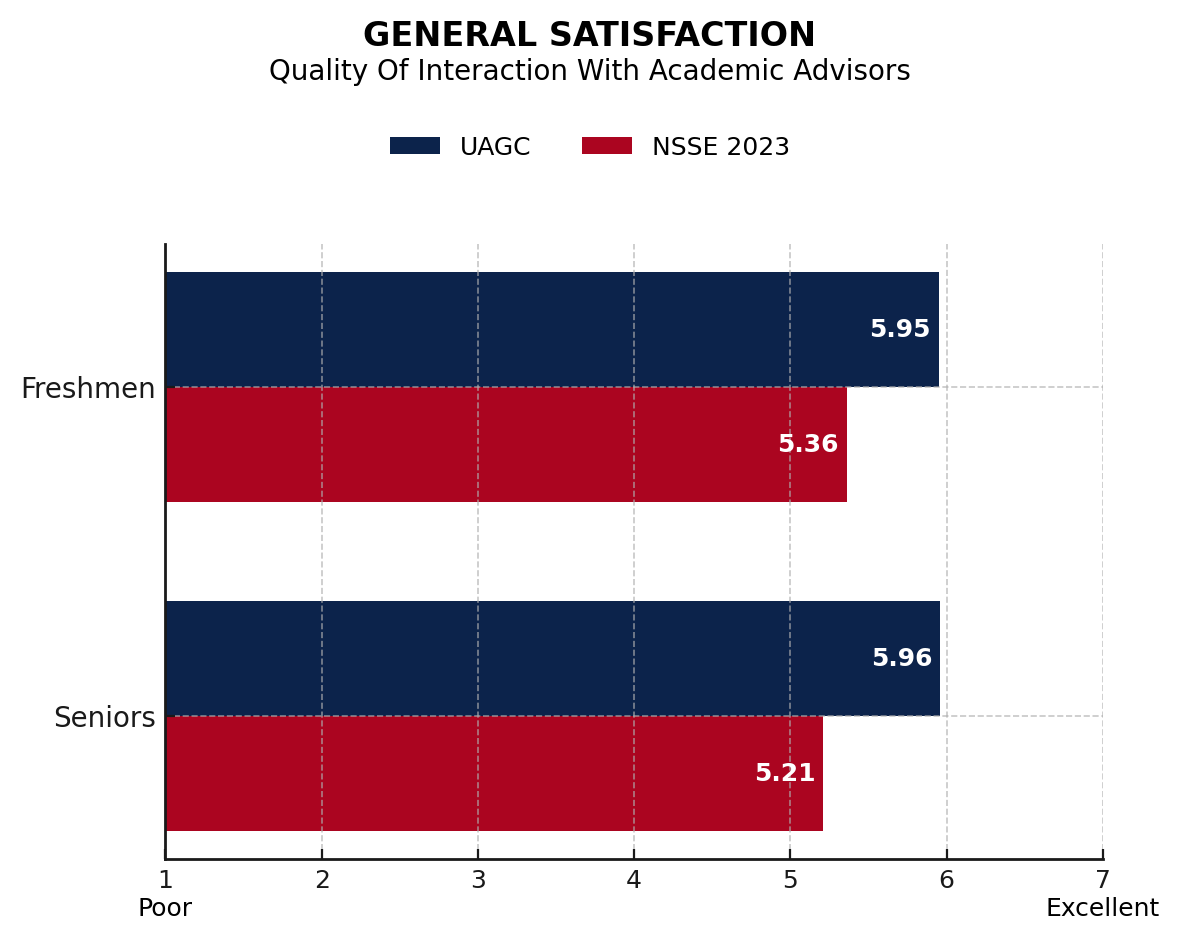
A. Indicate the quality of your interactions with the following people at your institution: Academic Advisors
Scale: 1=Poor, 7=ExcellentSource: Office of Institutional Effectiveness, 2023
NOTE: March-May 2023 survey of 8,106 University of Arizona Global Campus first-year (FY) and senior (SR) students (FY=3,405; SR=4,701). Sample size obtained: 1,535. Overall response rate: 19%. -
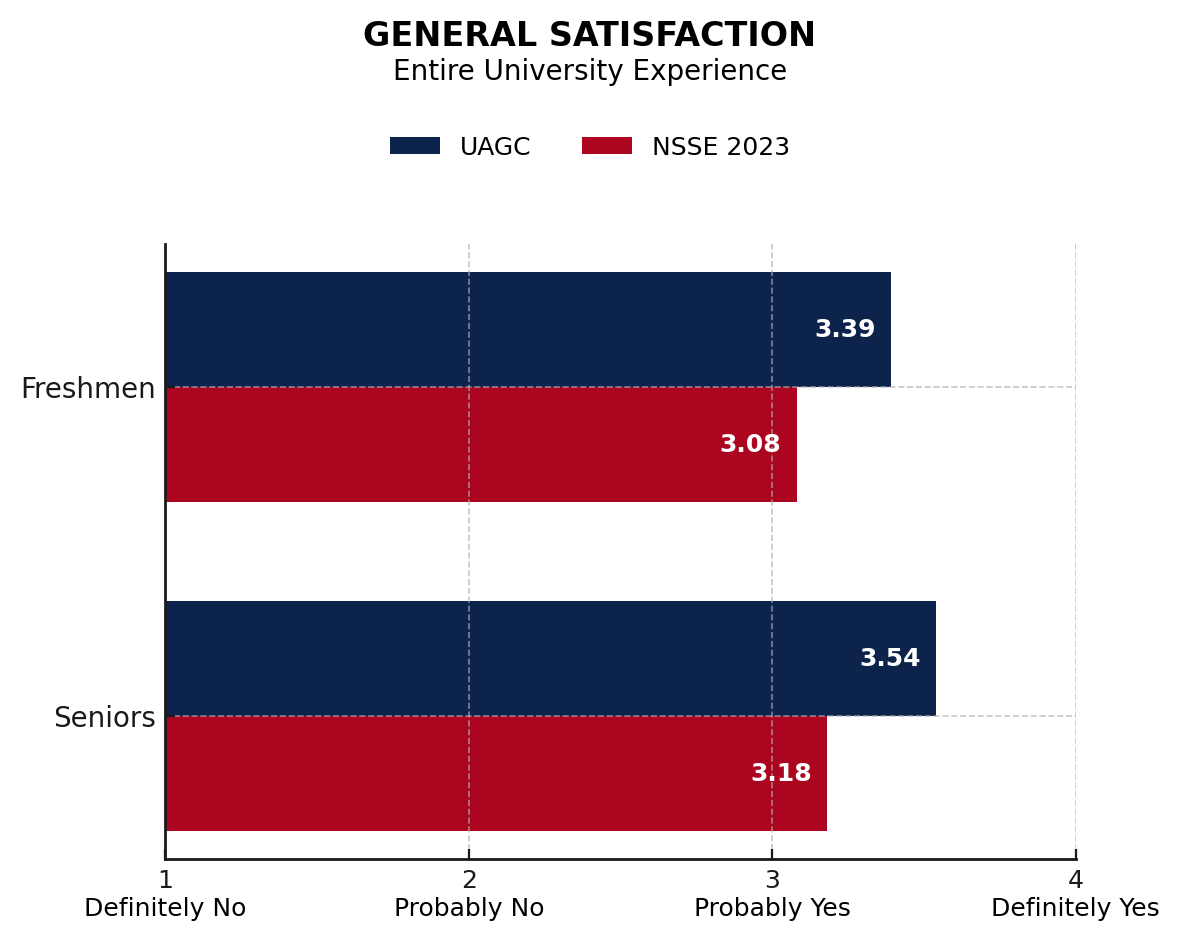
B. How would you evaluate your entire educational experience at this institution?
Scale: 1=Poor, 2=Fair, 3=Good, 4=ExcellentSource: Office of Institutional Effectiveness, 2023
NOTE: March-May 2023 survey of 8,106 University of Arizona Global Campus first-year (FY) and senior (SR) students (FY=3,405; SR=4,701). Sample size obtained: 1,535. Overall response rate: 19%. -
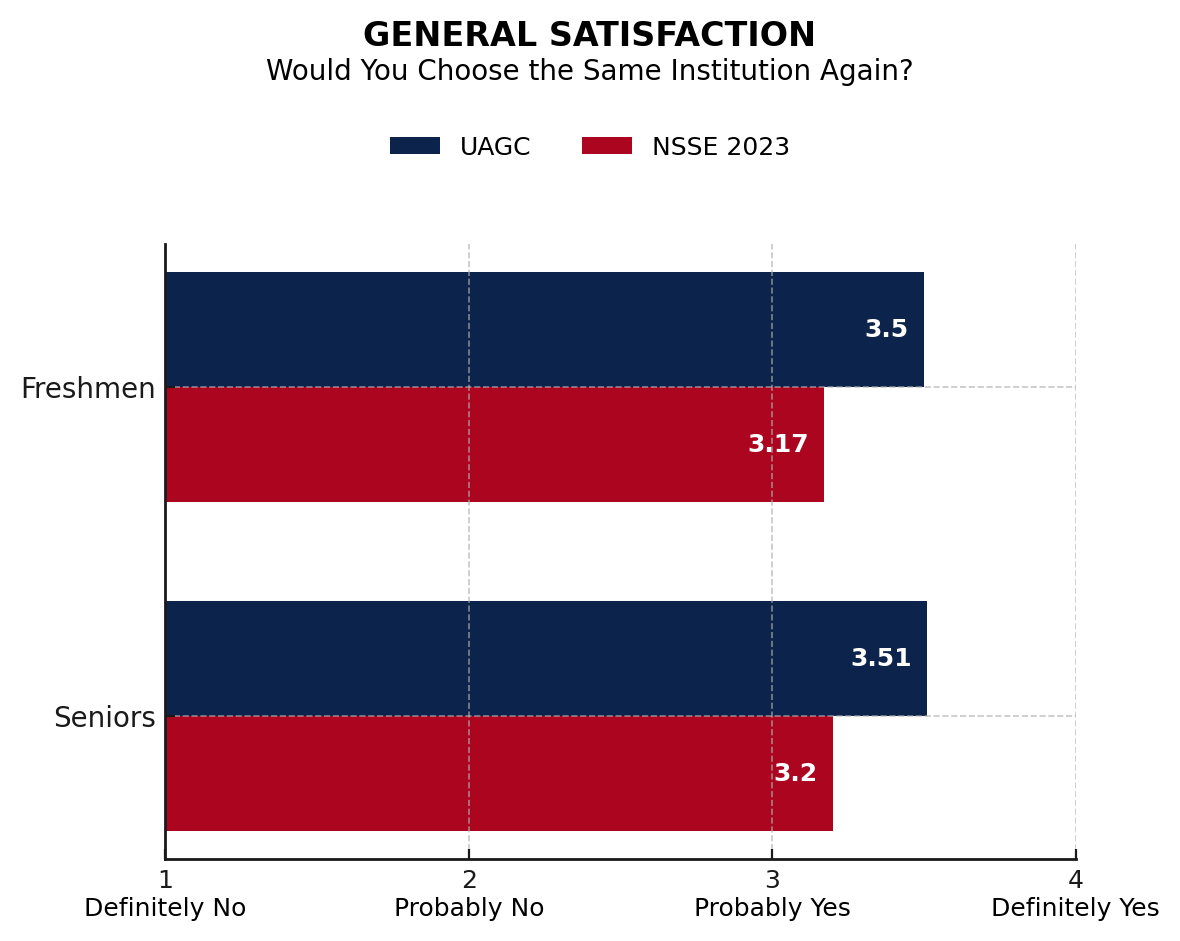
C. If you could start over again, would you go to the same institution you are now attending?
Scale: 1=Definitely no, 2=Probably no, 3=Probably yes, 4=Definitely yesSource: Office of Institutional Effectiveness, 2023
NOTE: March-May 2023 survey of 8,106 University of Arizona Global Campus first-year (FY) and senior (SR) students (FY=3,405; SR=4,701). Sample size obtained: 1,535. Overall response rate: 19%.
Synthesize theories and approaches from the subject areas of general education curriculum to address complex problems
Responding University of Arizona Global Campus students at the senior level indicate the University of Arizona Global Campus has contributed to connect their learning to societal problems and issues at a higher rate than the national comparison group. At the freshmen level, the two groups’ perceptions of learning are the same as they pertain to the connection to societal problems or issues.
See Synthesize Theories tab below.
-
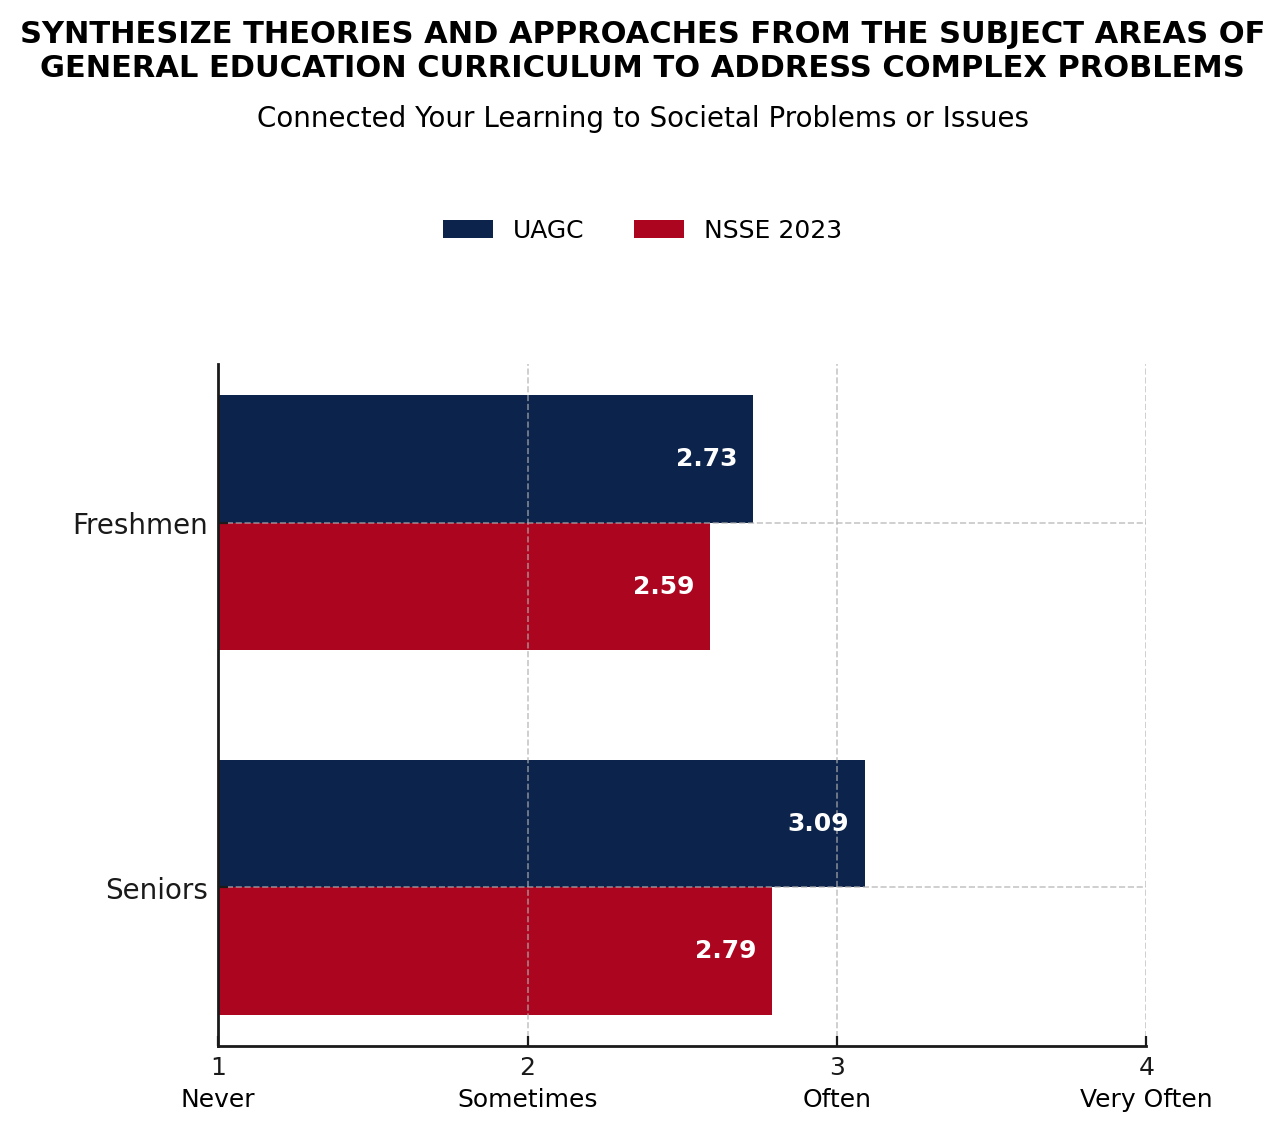
A. Connected your learning to societal problems
Scale: 1 = Never, 2 = Sometimes, 3 = Often, 4 = Very oftenSource: Office of Institutional Effectiveness, 2023
NOTE: March-May 2023 survey of 8,106 University of Arizona Global Campus first-year (FY) and senior (SR) students (FY=3,405; SR=4,701). Sample size obtained: 1,535. Overall response rate: 19%.
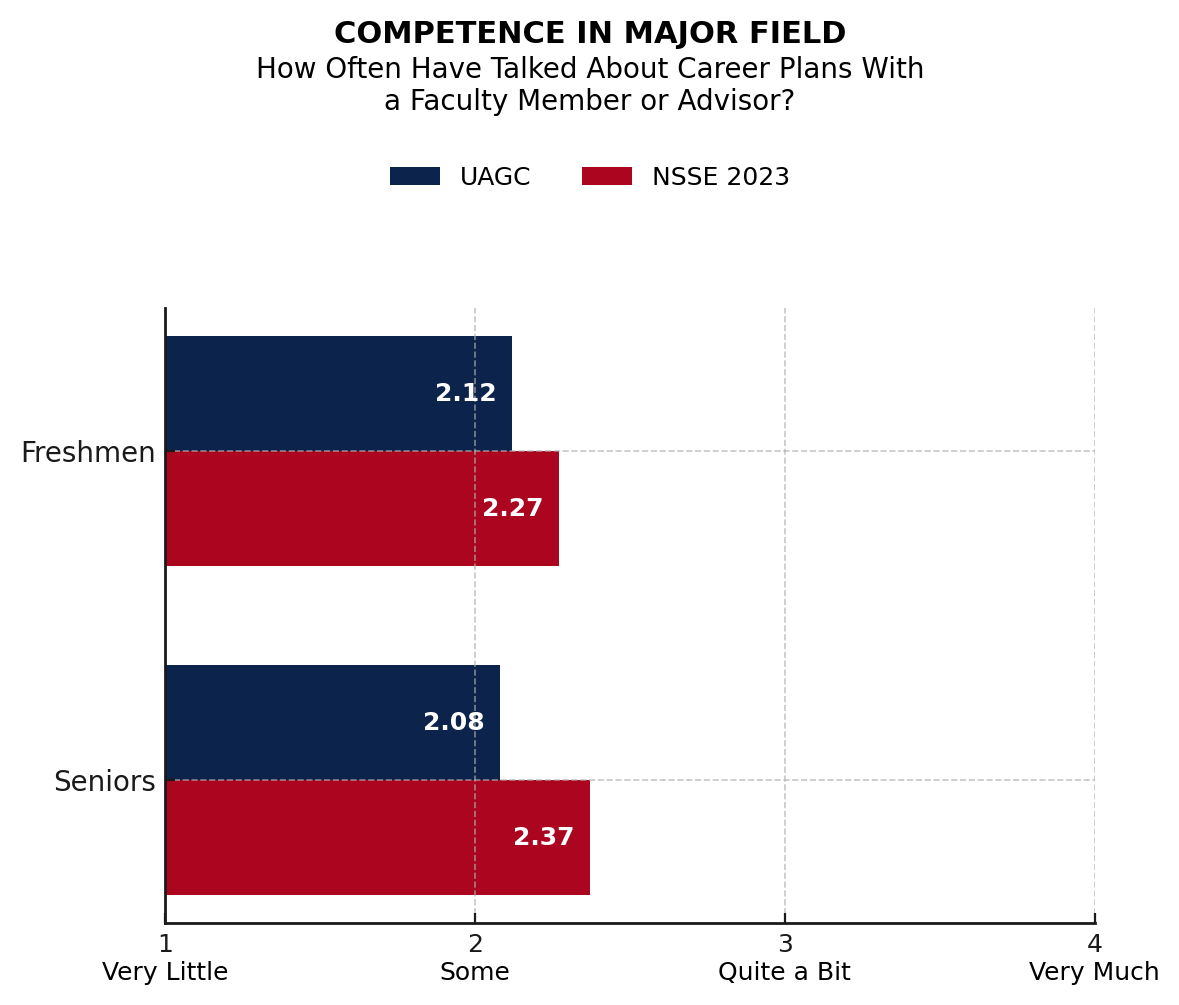
Competence in major field
The University of Arizona Global Campus seniors report having talked about career plans with a faculty member or advisor at a significantly lower rate than the NSSE averages. The Career Services website hosts information and tools for students and alumni at every stage of the career development process. By accessing the career portal, students can schedule appointments with advisors, locate events and search and apply for jobs. The website provides additional resources for self-assessment, career exploration, interview preparation, the job search process, in addition to career-related webinars and recorded videos.
See Competence tab below.
-
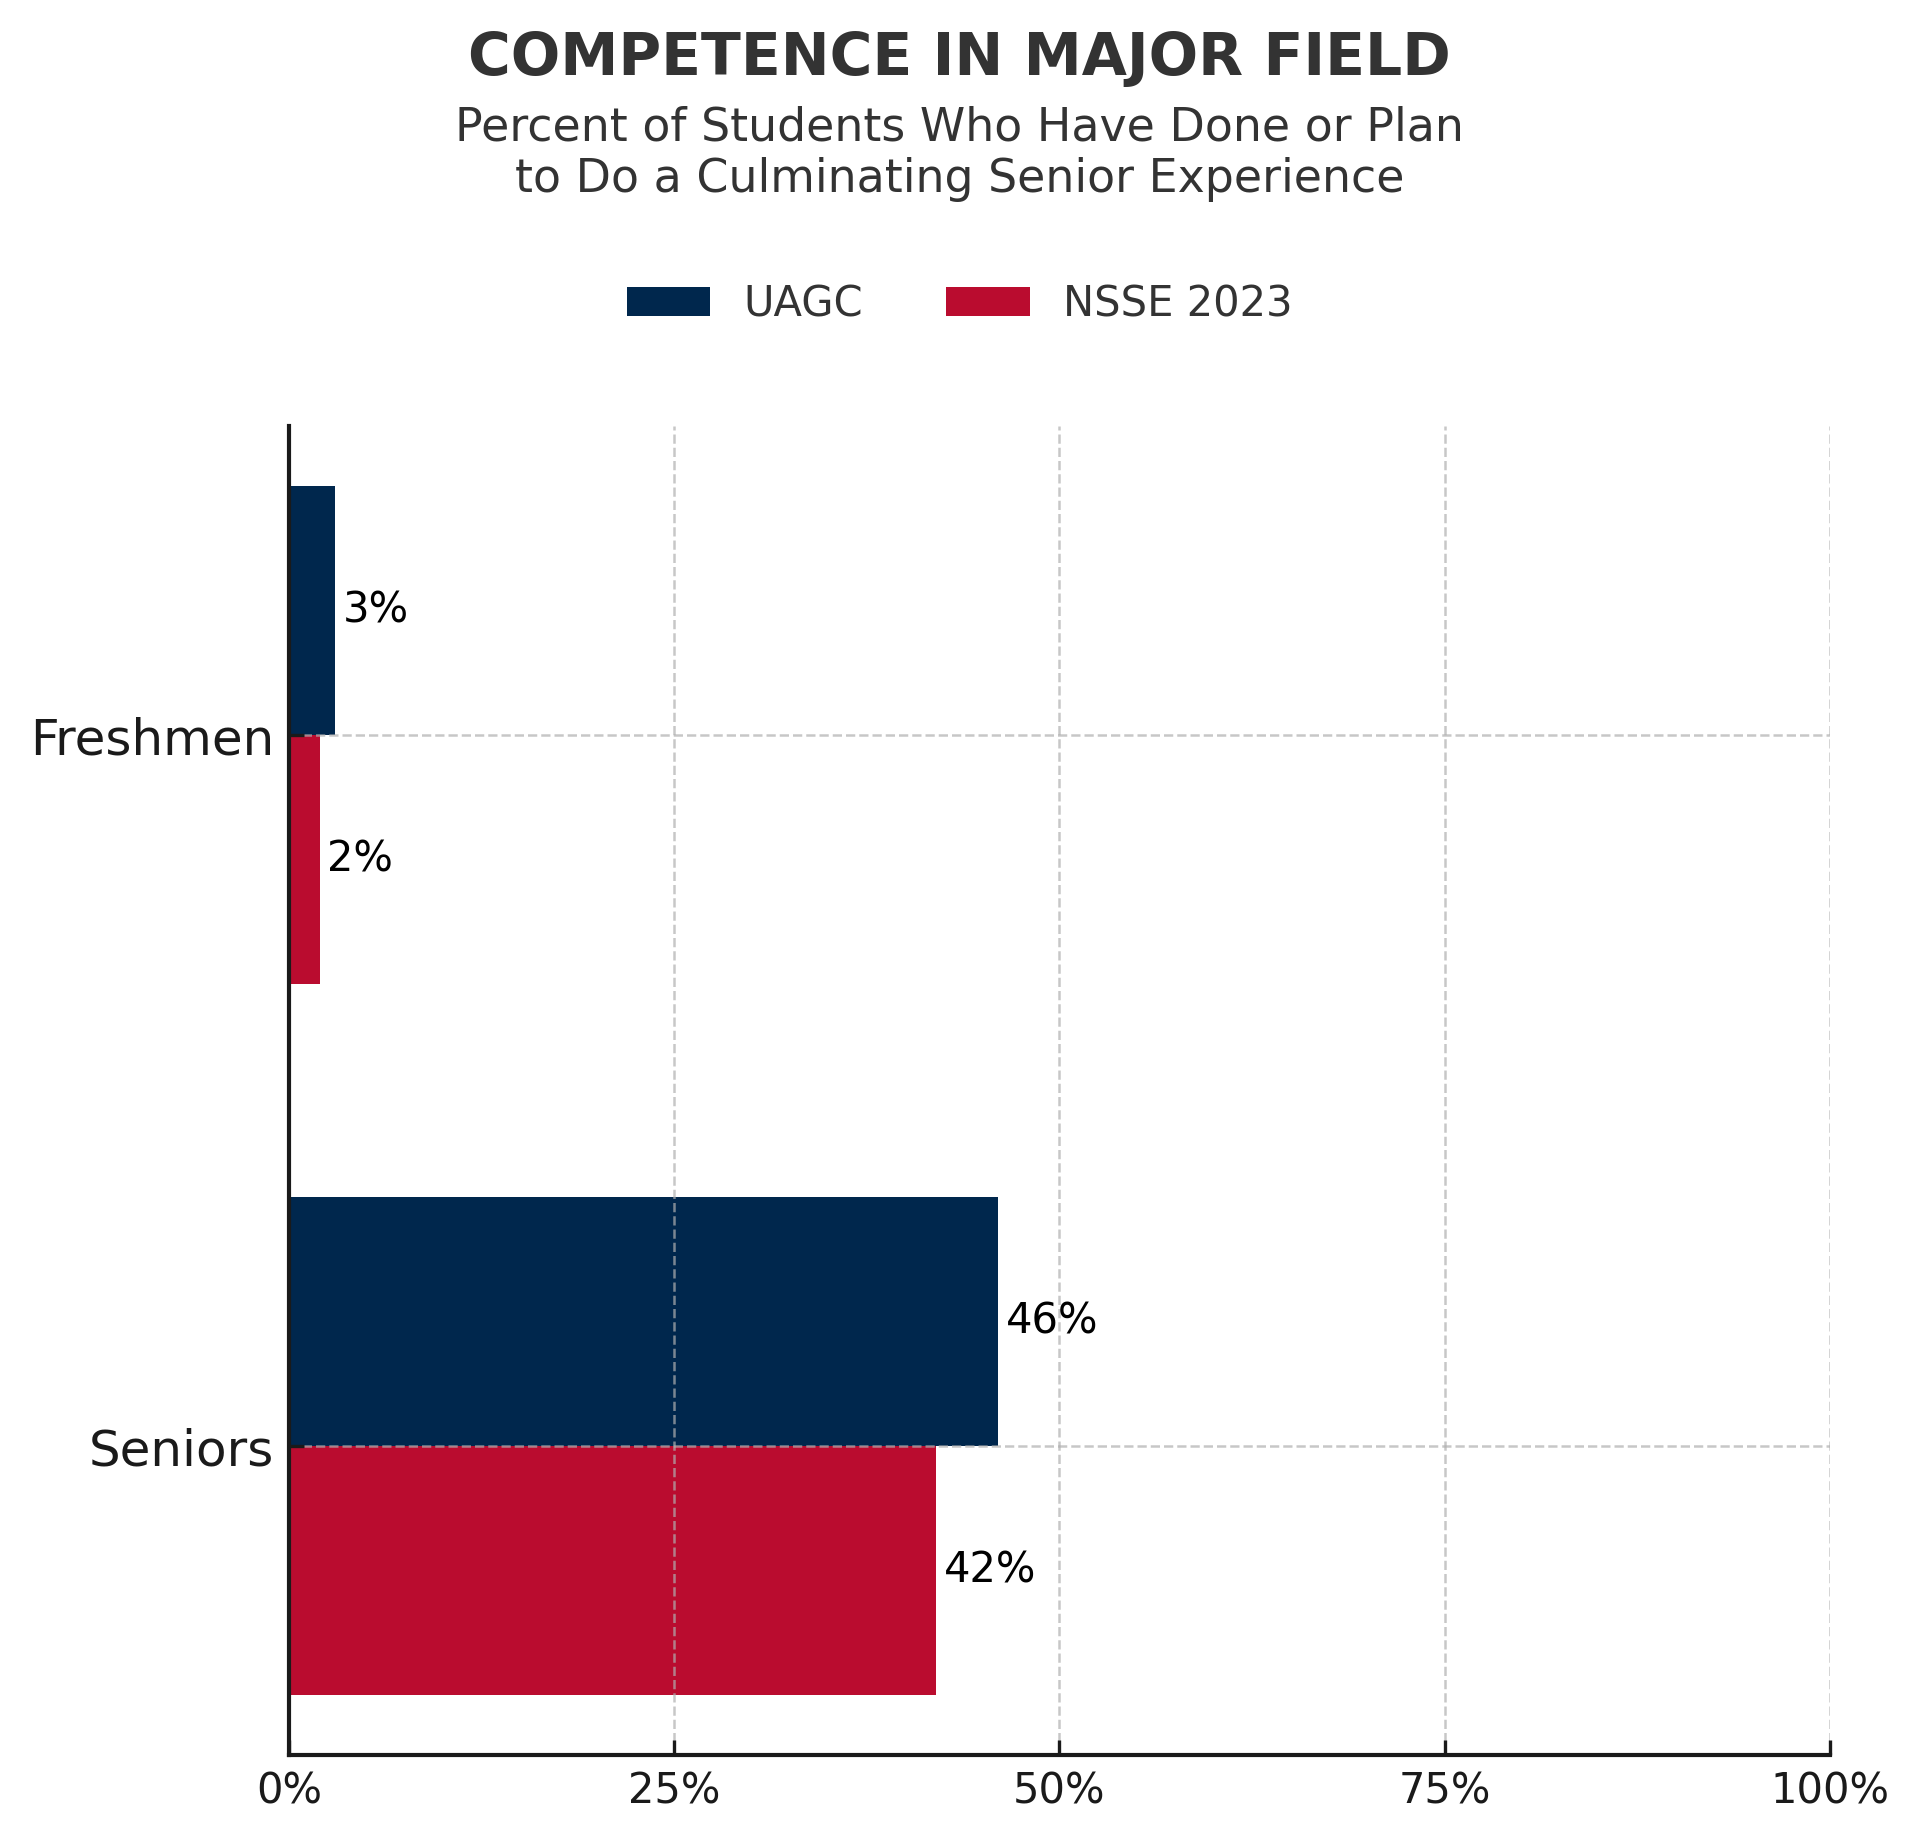
A. Which of the following have you done or do you plan to do before you graduate from your institution?
Recorded: 0 = Have not decided, Do not plan to do, Plan to do; 1 = Done. Thus, the mean is the proportion responding “Done or in progress” among all valid respondents.Source: Office of Institutional Effectiveness, 2023
NOTE: March-May 2023 survey of 8,106 University of Arizona Global Campus first-year (FY) and senior (SR) students (FY=3,405; SR=4,701). Sample size obtained: 1,535. Overall response rate: 19%. -
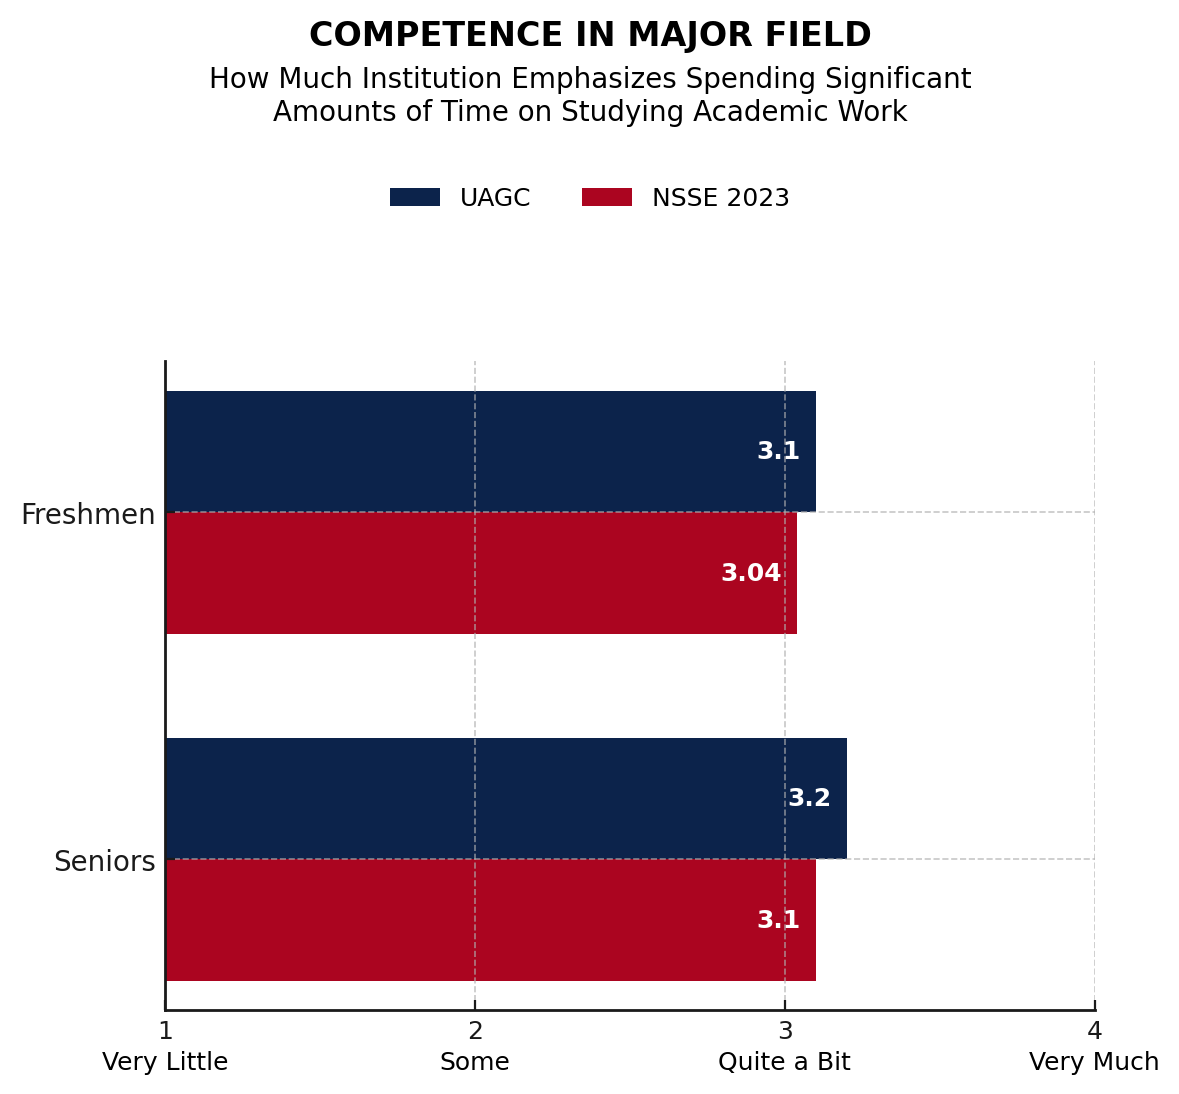
B. How much does your institution emphasize the following?
Scale: 1 = Very little, 2 = Some, 3 = Quite a bit, 4 = Very muchSource: Office of Institutional Effectiveness, 2023
NOTE: March-May 2023 survey of 8,106 University of Arizona Global Campus first-year (FY) and senior (SR) students (FY=3,405; SR=4,701). Sample size obtained: 1,535. Overall response rate: 19%. -
C. During the current school year, about how often have you done the following?
Scale: 1 = Never, 2 = Sometimes, 3 = Often, 4 = Very oftenSource: Office of Institutional Effectiveness, 2023
NOTE: March-May 2023 survey of 8,106 University of Arizona Global Campus first-year (FY) and senior (SR) students (FY=3,405; SR=4,701). Sample size obtained: 1,535. Overall response rate: 19%.
Integrate skills from the general education competencies when interpreting ideas and arguments in order to respond to civic, societal, environmental, and economic challenges
Responding University of Arizona Global Campus students indicate the University of Arizona Global Campus has contributed to their development in examining the strengths and weaknesses of their own perspectives at a higher rate than the national comparison group. Similarly, students report having learned something that changed the way they understand an issue or concept at a higher rate than the comparison group. At the University of Arizona Global Campus, learning activities are incorporated into courses that help students connect their learning to societal problems and issues. At the senior level, students indicate that the University of Arizona Global Campus has helped make this connection at a higher rate than the national comparison group whereas at the freshmen level, the two groups’ perceptions of learning are the same.
See Integrate Skills tab below.
-
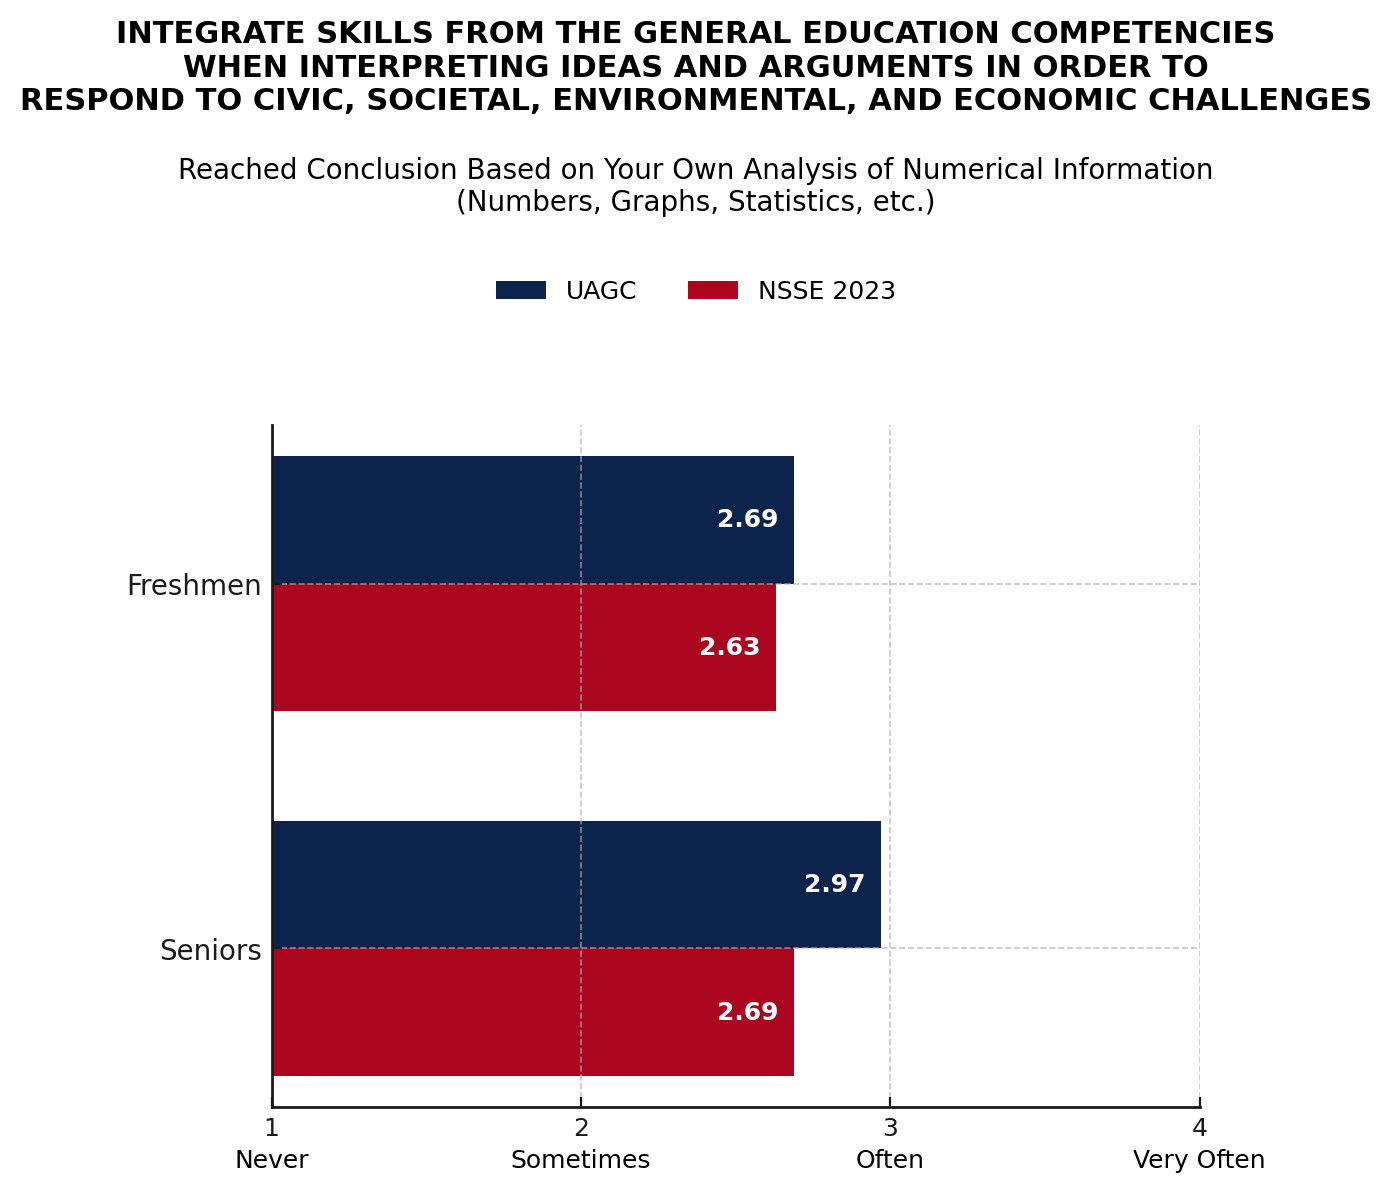
A. Reached conclusions based on your own analysis of numerical information (numbers, graphs, statistics, etc.)
Scale: 1 = Never, 2 = Sometimes, 3 = Often, 4 = Very oftenSource: Office of Institutional Effectiveness, 2023
NOTE: March-May 2023 survey of 8,106 University of Arizona Global Campus first-year (FY) and senior (SR) students (FY=3,405; SR=4,701). Sample size obtained: 1,535. Overall response rate: 19%. -
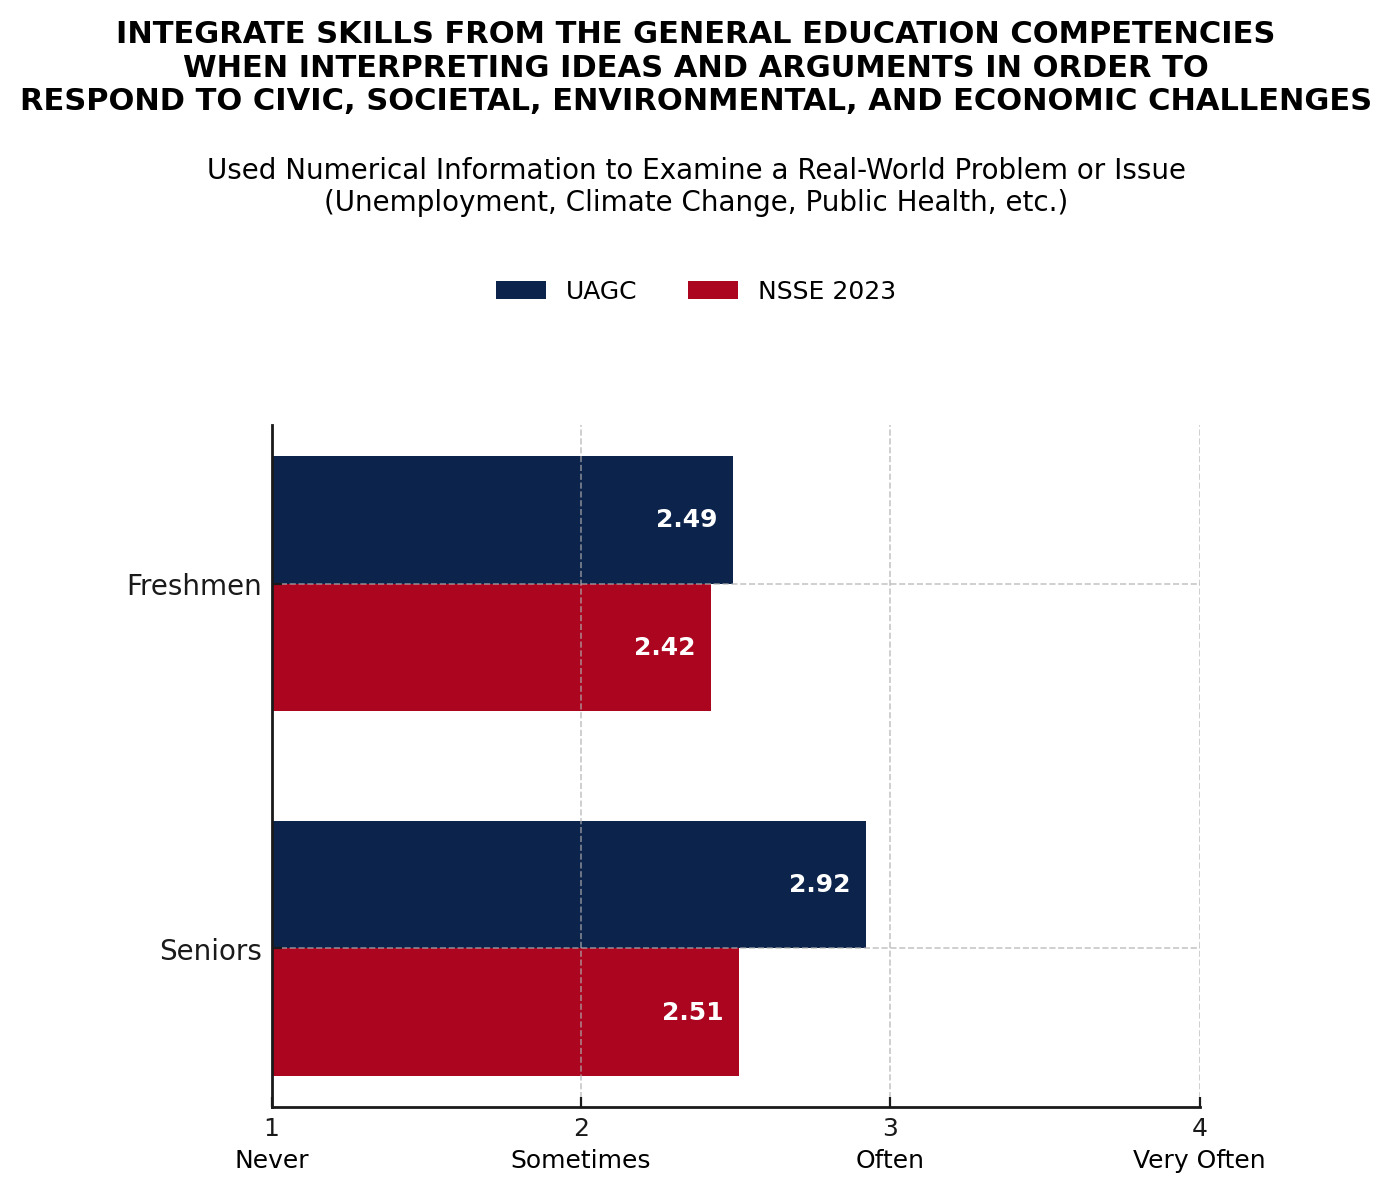
B. Used numerical information to examine a real-world problem or issue (unemployment, climate change, public health, etc.)
Scale: 1 = Never, 2 = Sometimes, 3 = Often, 4 = Very oftenSource: Office of Institutional Effectiveness, 2023
NOTE: March-May 2023 survey of 8,106 University of Arizona Global Campus first-year (FY) and senior (SR) students (FY=3,405; SR=4,701). Sample size obtained: 1,535. Overall response rate: 19%. -
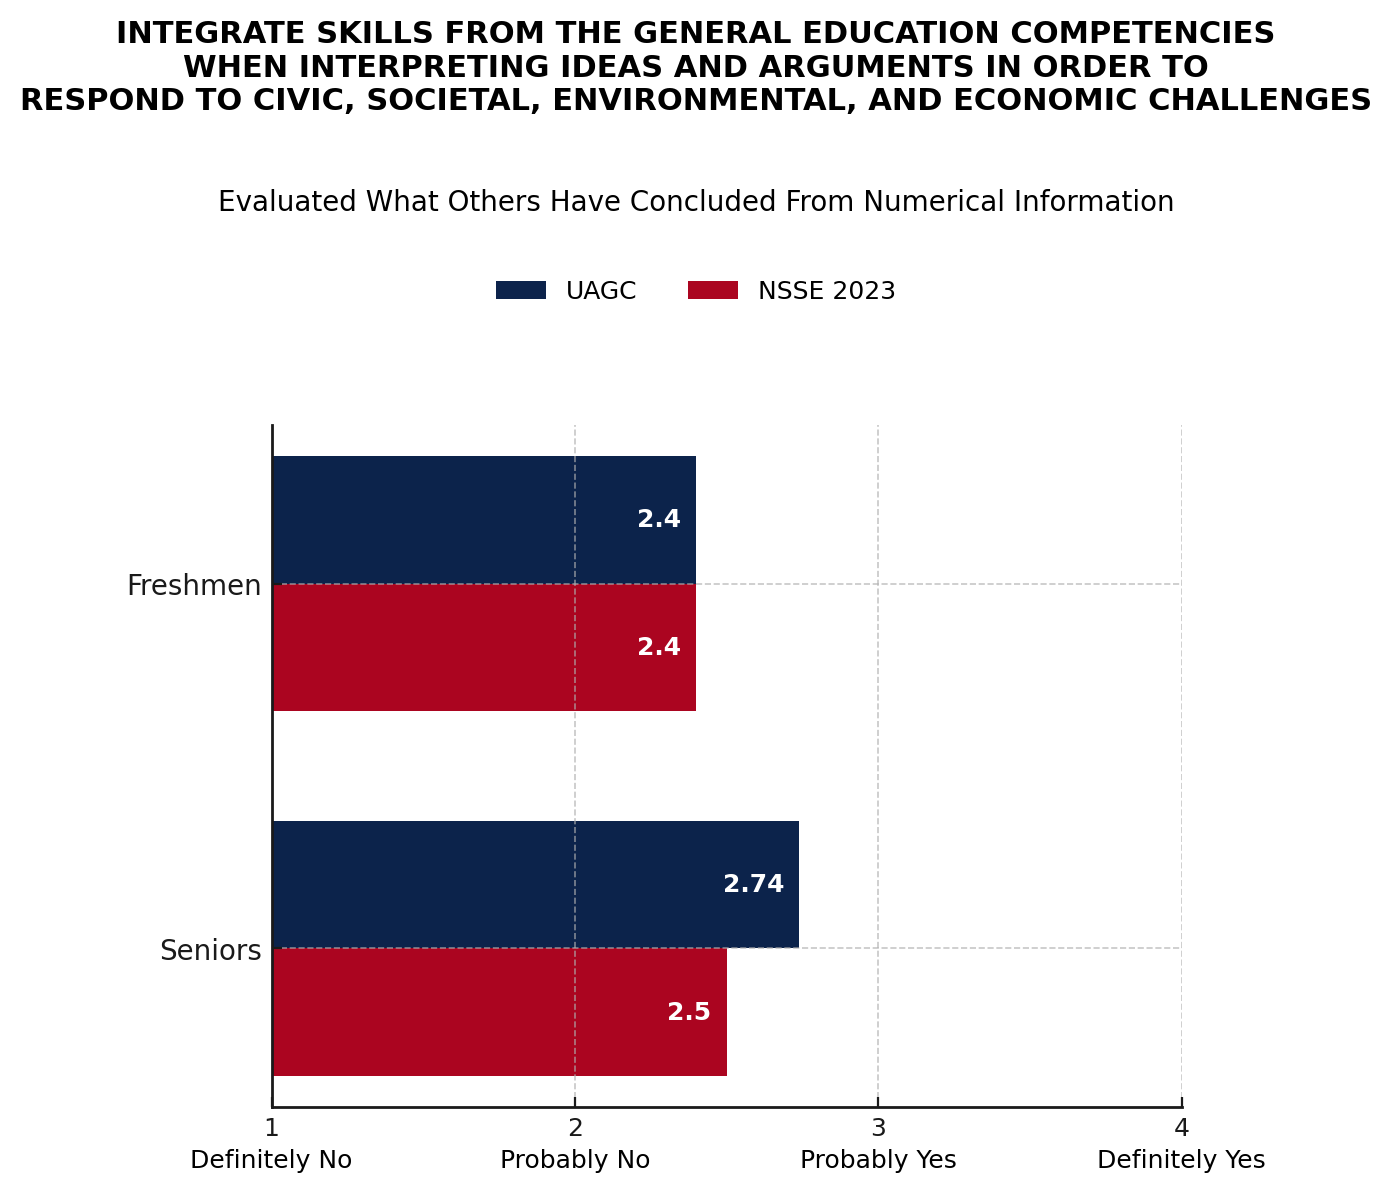
C. Evaluated what others have concluded from numerical information
Scale: 1 = Never, 2 = Sometimes, 3 = Often, 4 = Very oftenSource: Office of Institutional Effectiveness, 2023
NOTE: March-May 2023 survey of 8,106 University of Arizona Global Campus first-year (FY) and senior (SR) students (FY=3,405; SR=4,701). Sample size obtained: 1,535. Overall response rate: 19%.
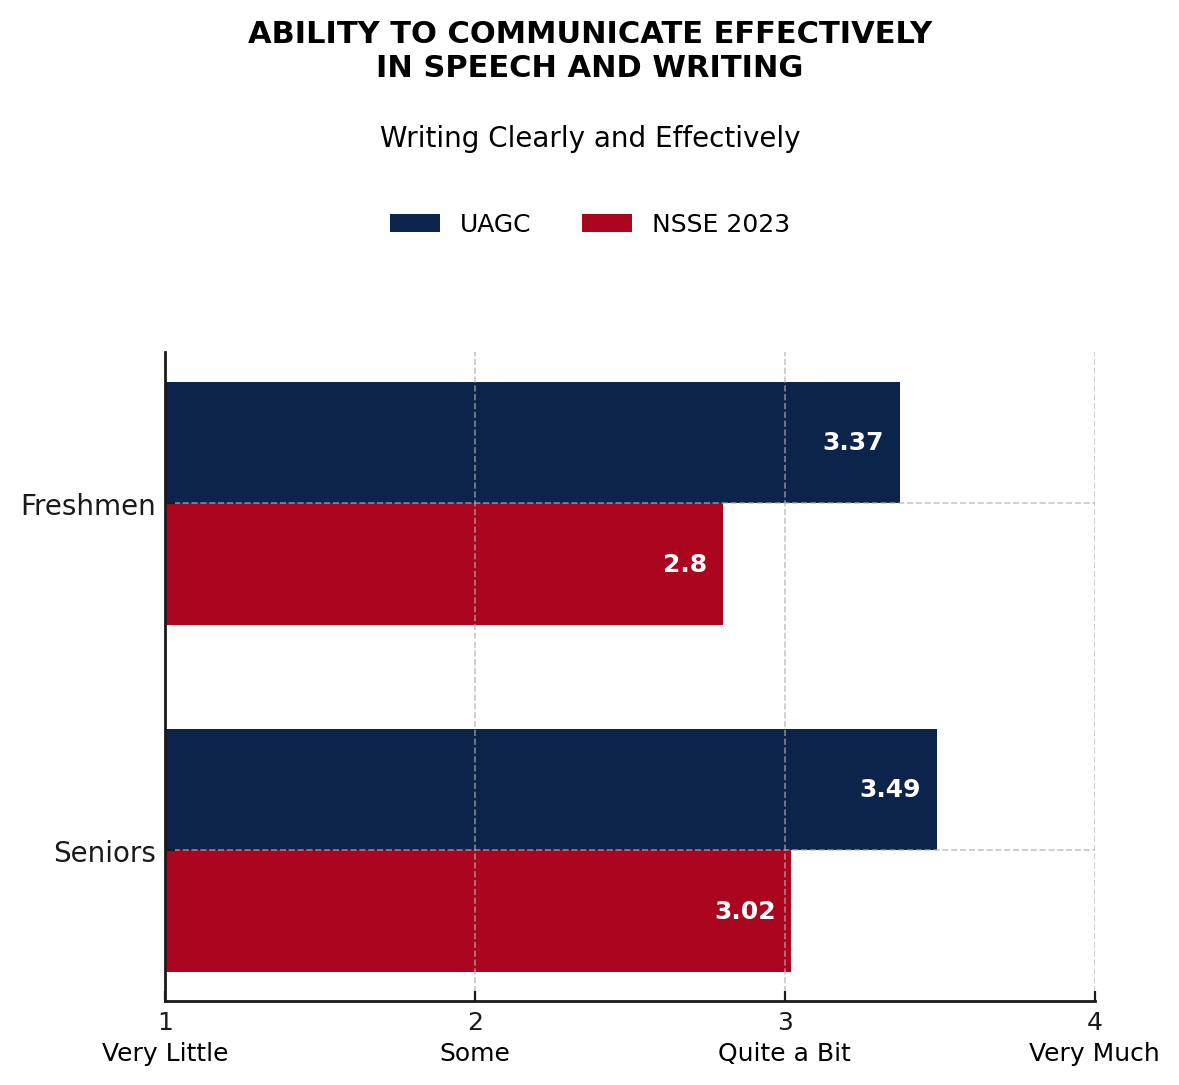
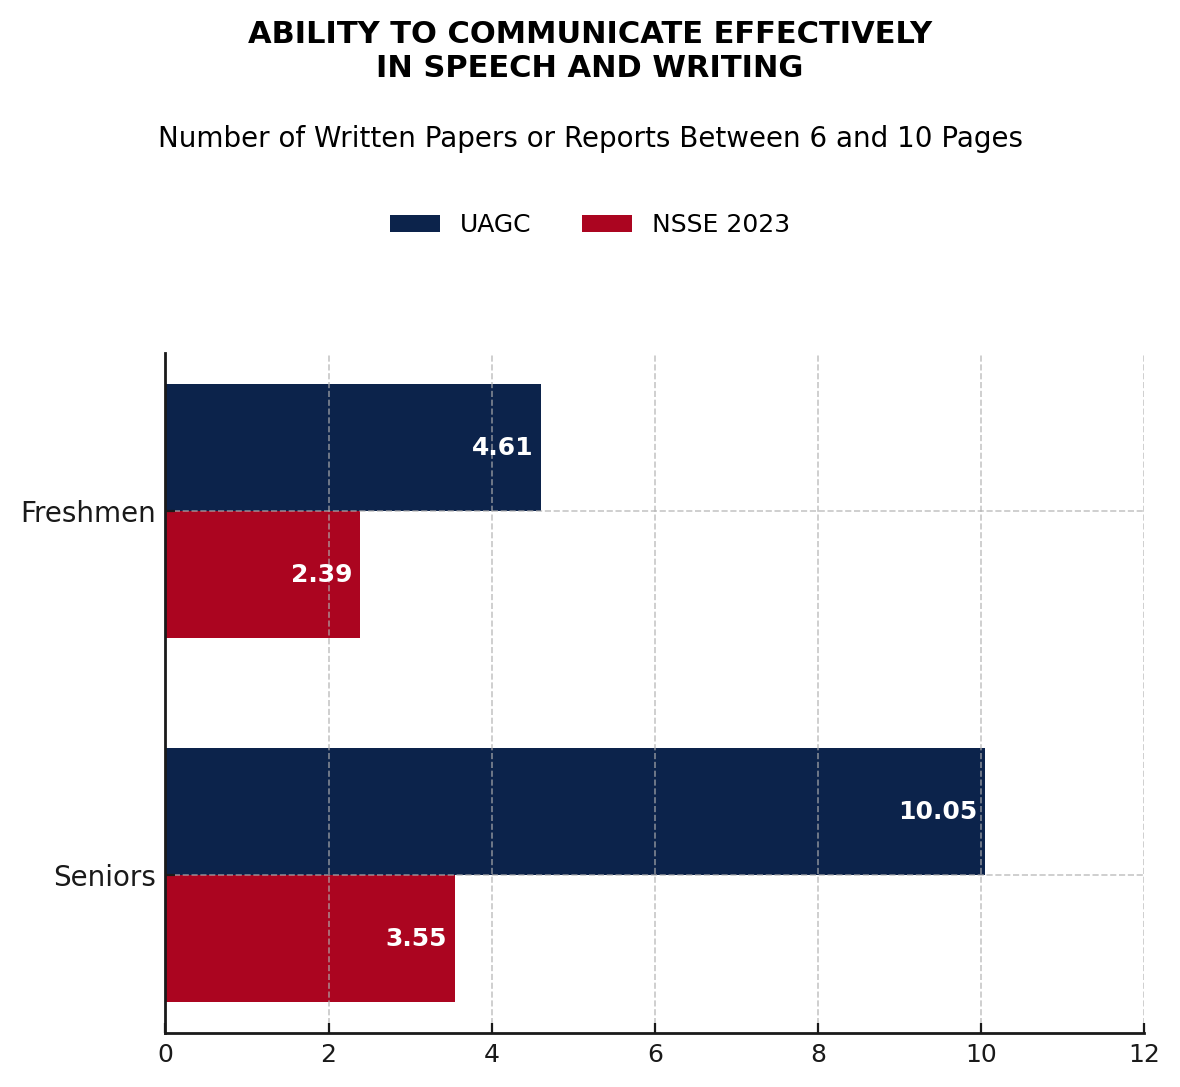
Ability to communicate effectively in speech and writing
The University of Arizona Global Campus respondents rated themselves significantly higher than the national averages in the extent to which their experience at the institution contributes to developing the skills of writing clearly and effectively. University of Arizona Global Campus courses require regular discussion posts, where students have many opportunities to develop and apply good writing skills. Students report significantly more writing assignments (written papers or reports between 6 and 10 pages) than national averages, with a stronger difference seen at the senior level, further highlighting the emphasis on writing skill development at the University of Arizona Global Campus. The Writing Center is a resource currently available to students to develop their skills in this area. The Writing Center offers 24/7 live chat, paper review, writing and APA guides and webinars and tutorials.
See Speech & Writing tab below.
-
A. How much has your experience at this institution contributed to your knowledge, skills, and personal development in the following areas?
Scale: 1=Very little, 2=Some, 3=Quite a bit, 4=Very muchSource: Office of Institutional Effectiveness, 2023
NOTE: March-May 2023 survey of 8,106 University of Arizona Global Campus first-year (FY) and senior (SR) students (FY=3,405; SR=4,701). Sample size obtained: 1,535. Overall response rate: 19%. -
B. During the current school year, about how many papers, reports, or other writing tasks of the following length have you been assigned? (Include those not yet completed.)
Scale: Between 6 and 10 pages (Values are estimated number of papers, reports, etc.).Source: Office of Institutional Effectiveness, 2023
NOTE: March-May 2023 survey of 8,106 University of Arizona Global Campus first-year (FY) and senior (SR) students (FY=3,405; SR=4,701). Sample size obtained: 1,535. Overall response rate: 19%.
Understanding of the various forms of diversity
Responding University of Arizona Global Campus students rated themselves above the national average ratings for seeking to better understand the perspectives of others and including diverse perspectives in coursework. Various forms of diversity are promoted through University of Arizona Global Campus Academic and Student Affairs initiatives. The student population of University of Arizona Global Campus lends itself to diverse dialogue, with discussion forum questions carefully crafted to stimulate conversations that include many different viewpoints. The discussion forums also promote diplomacy. Student guidelines for course discussions include respect for the diverse opinions of fellow learners. A discussion grading rubric further solidifies this point. The University of Arizona Global Campus promotes understanding for diversity with its Promoting Awareness and Wellness (PAWS) Initiative on the University of Arizona Global Campus website.
See Diversity tab below.
-
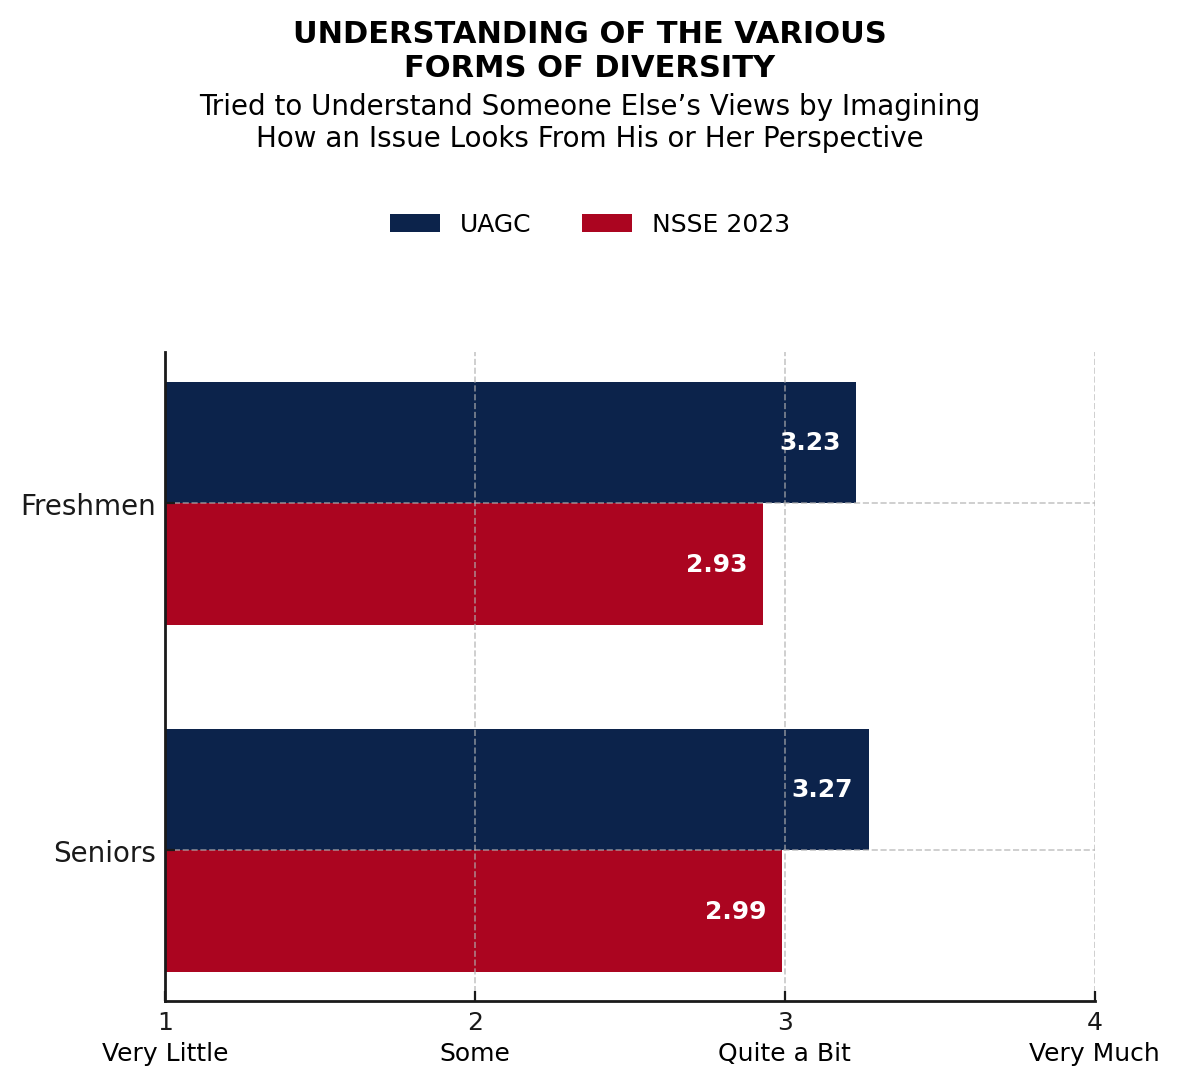
A. During the current school year, about how often have you done each of the following?
Scale: 1 = Never, 2 = Sometimes, 3 = Often, 4 = Very oftenSource: Office of Institutional Effectiveness, 2023
NOTE: March-May 2023 survey of 8,106 University of Arizona Global Campus first-year (FY) and senior (SR) students (FY=3,405; SR=4,701). Sample size obtained: 1,535. Overall response rate: 19%. -
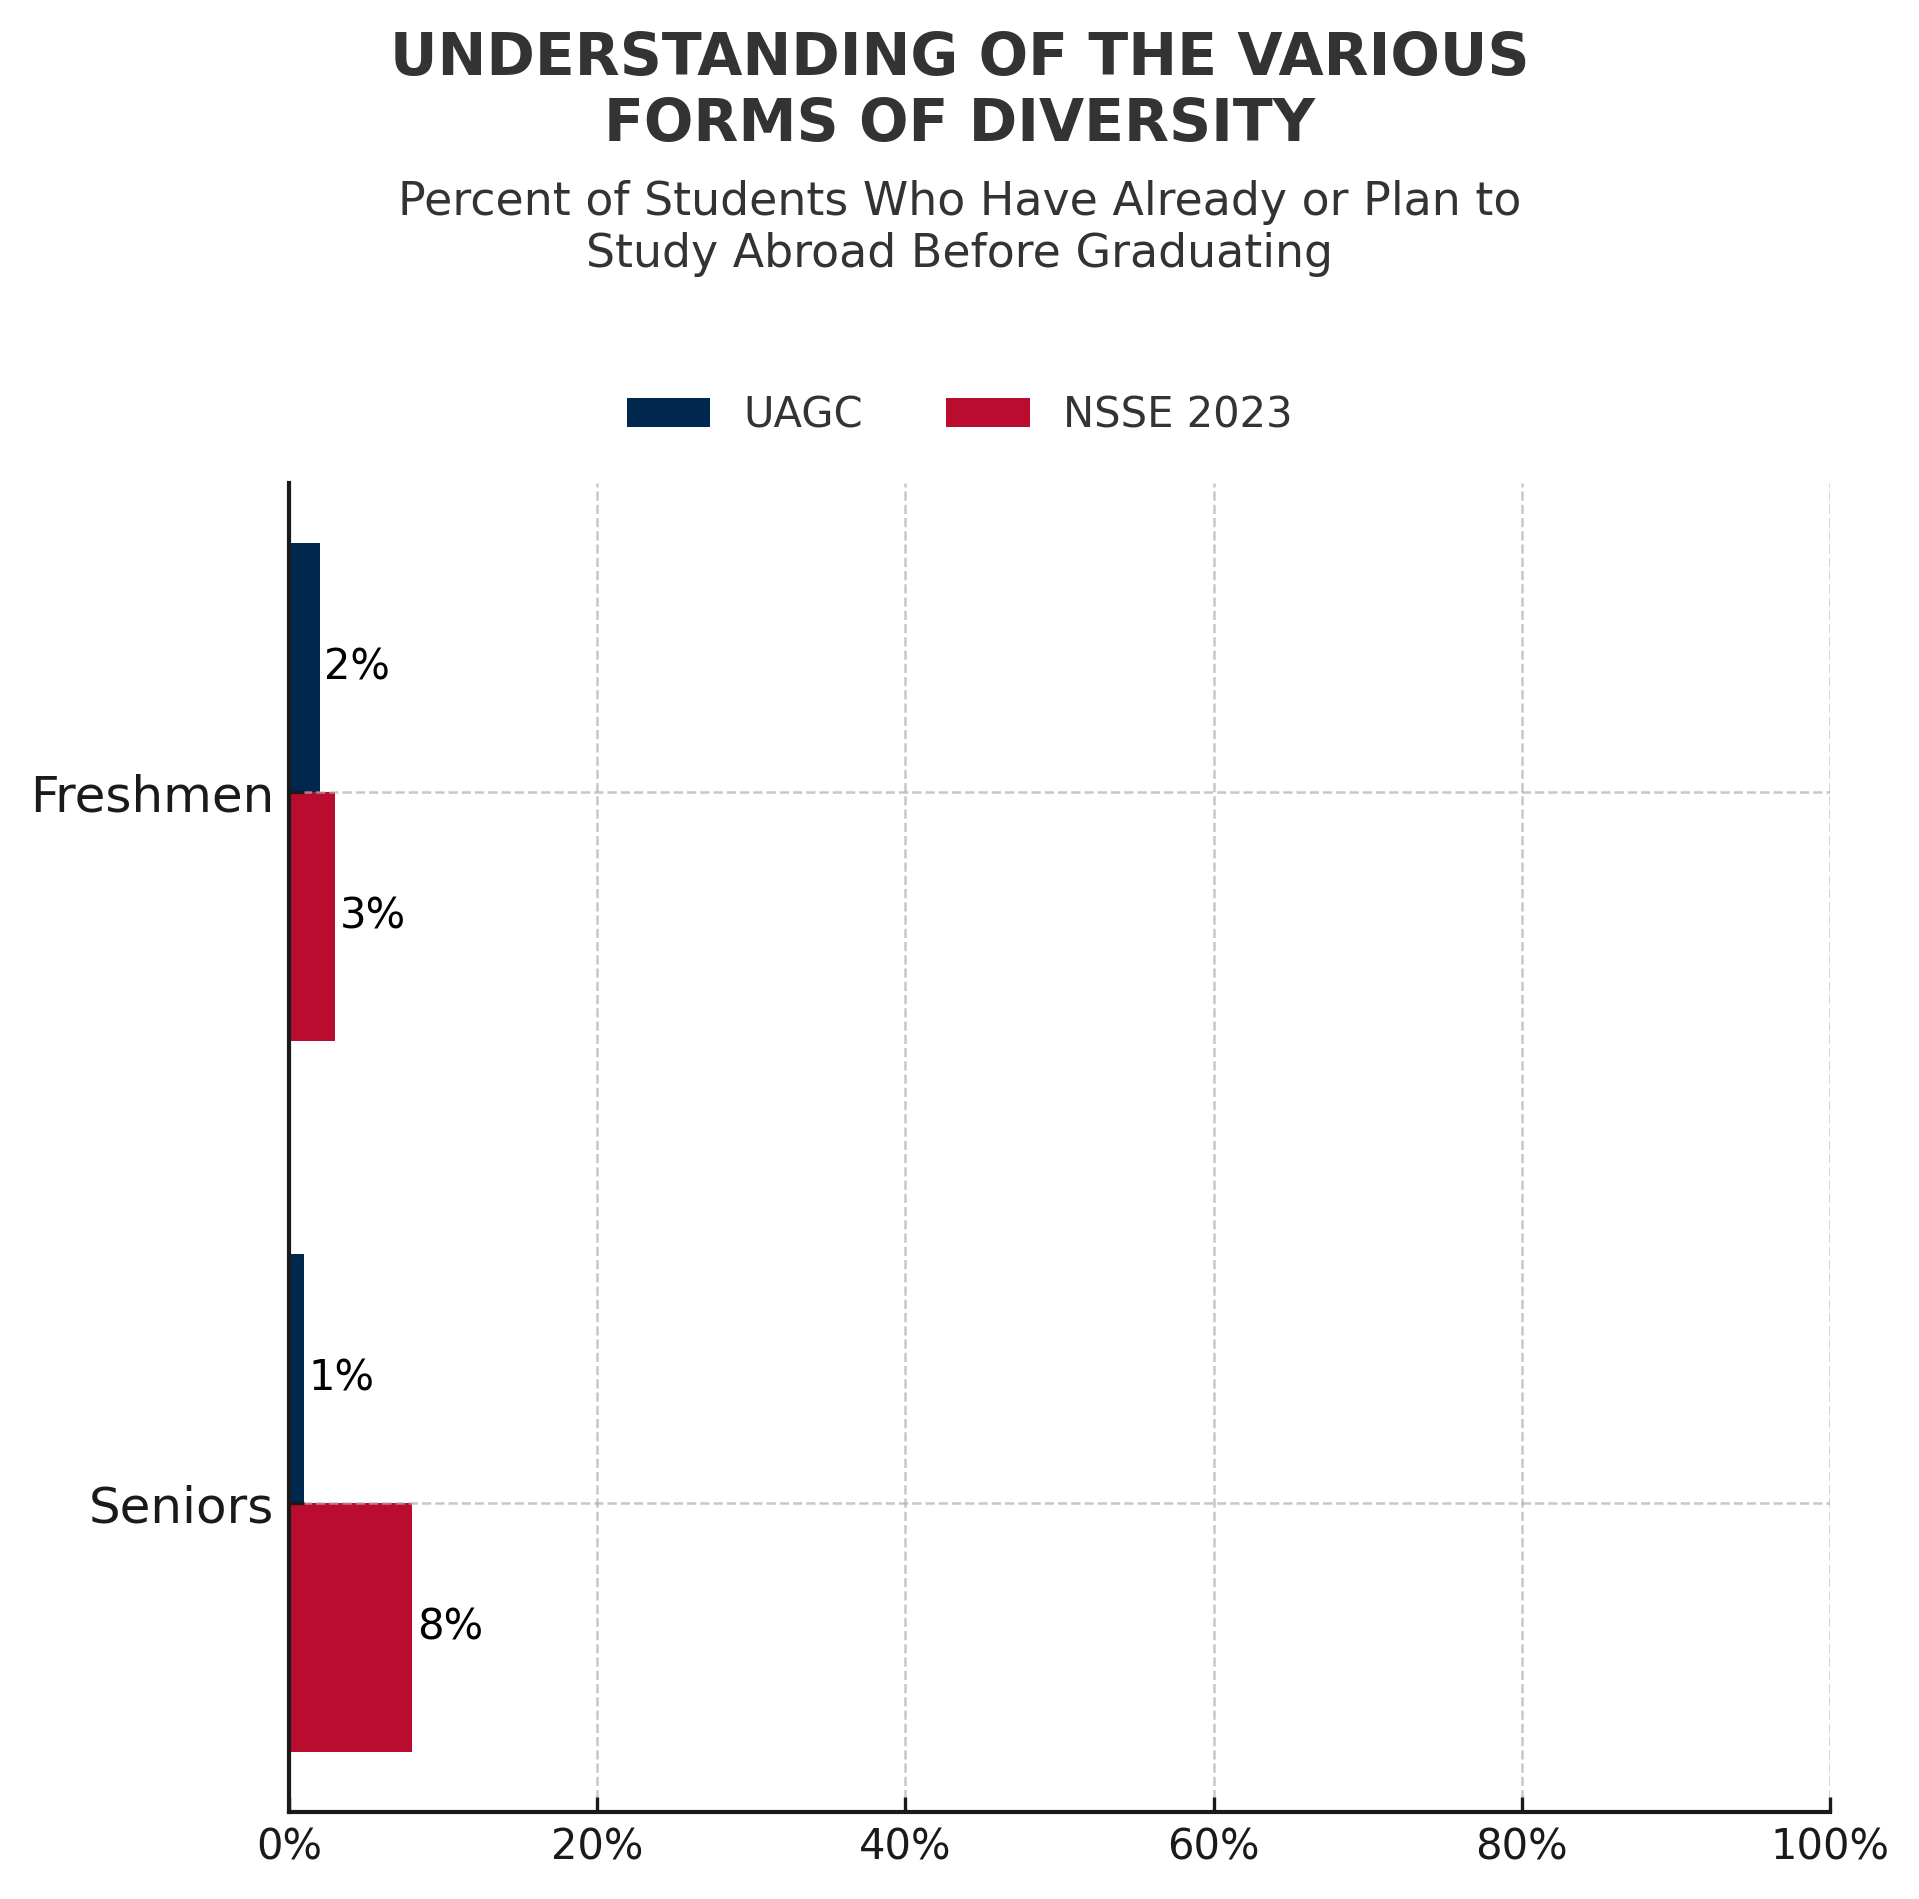
B. Which of the following have you done or do you plan to do before you graduate from your institution?
Recoded: 0 = Have not decided, Do not plan to do, Plan to do; 1 = Done. Thus, the mean is the proportion responding “Done or in progress” among all valid respondents.Source: Office of Institutional Effectiveness, 2023
NOTE: March-May 2023 survey of 8,106 University of Arizona Global Campus first-year (FY) and senior (SR) students (FY=3,405; SR=4,701). Sample size obtained: 1,535. Overall response rate: 19%. -
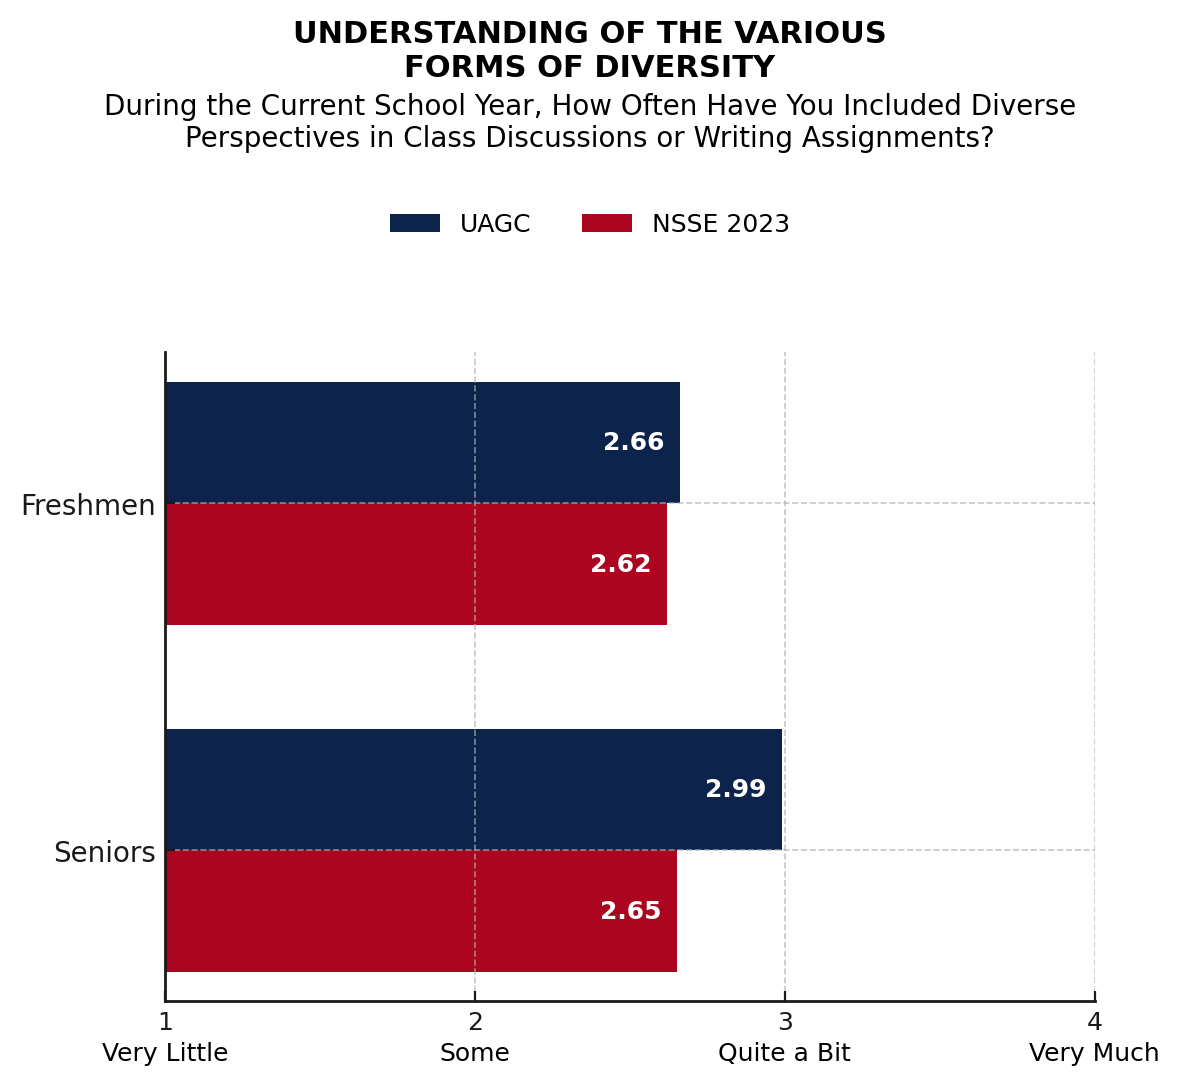
C. During the current school year, about how often have you done each of the following?
Scale: 1 = Never, 2 = Sometimes, 3 = Often, 4 = Very oftenSource: Office of Institutional Effectiveness, 2023
NOTE: March-May 2023 survey of 8,106 University of Arizona Global Campus first-year (FY) and senior (SR) students (FY=3,405; SR=4,701). Sample size obtained: 1,535. Overall response rate: 19%.
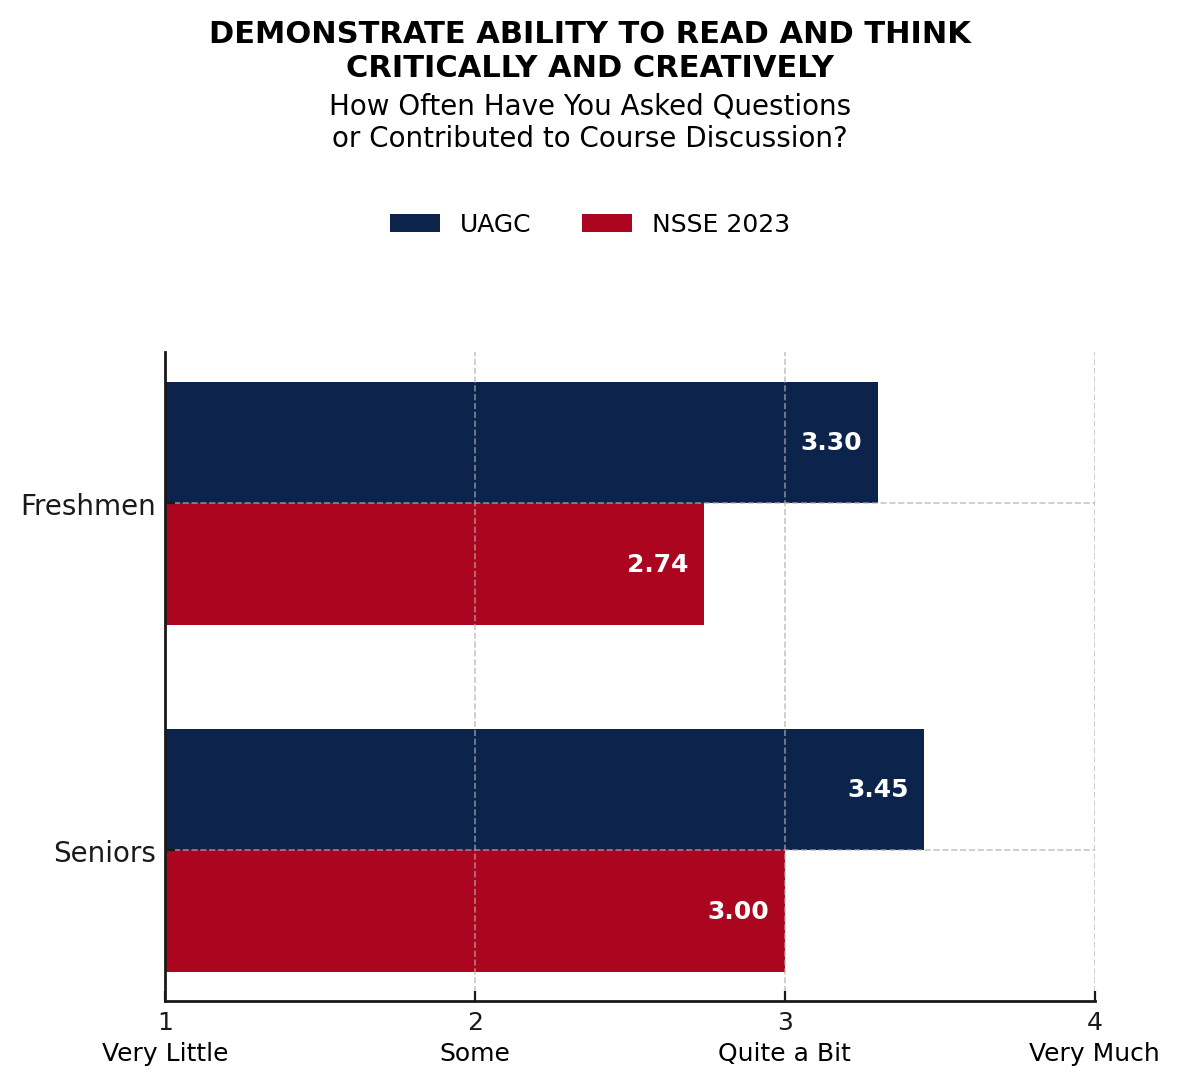
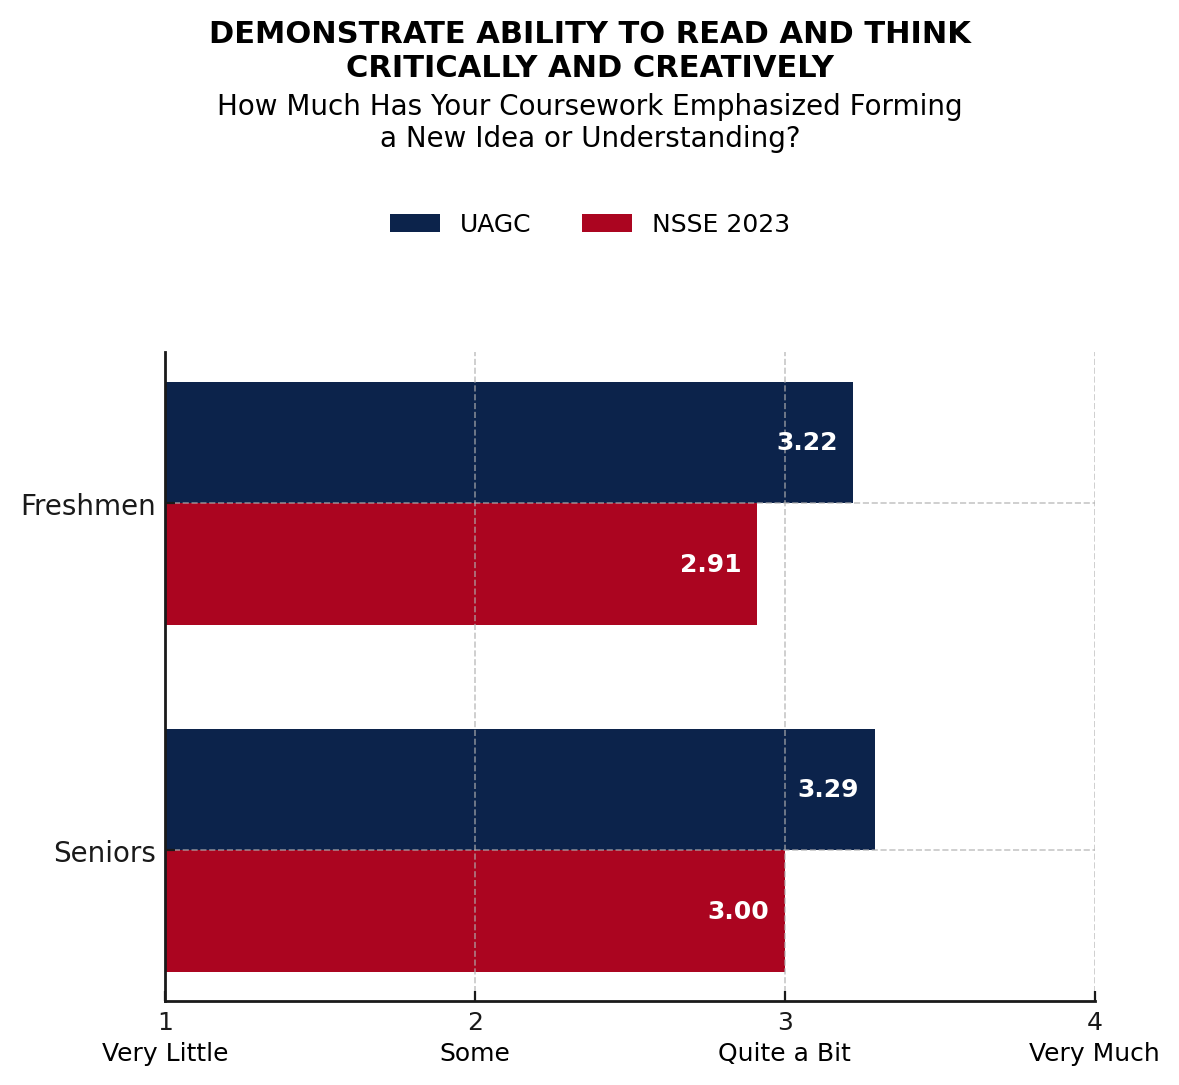
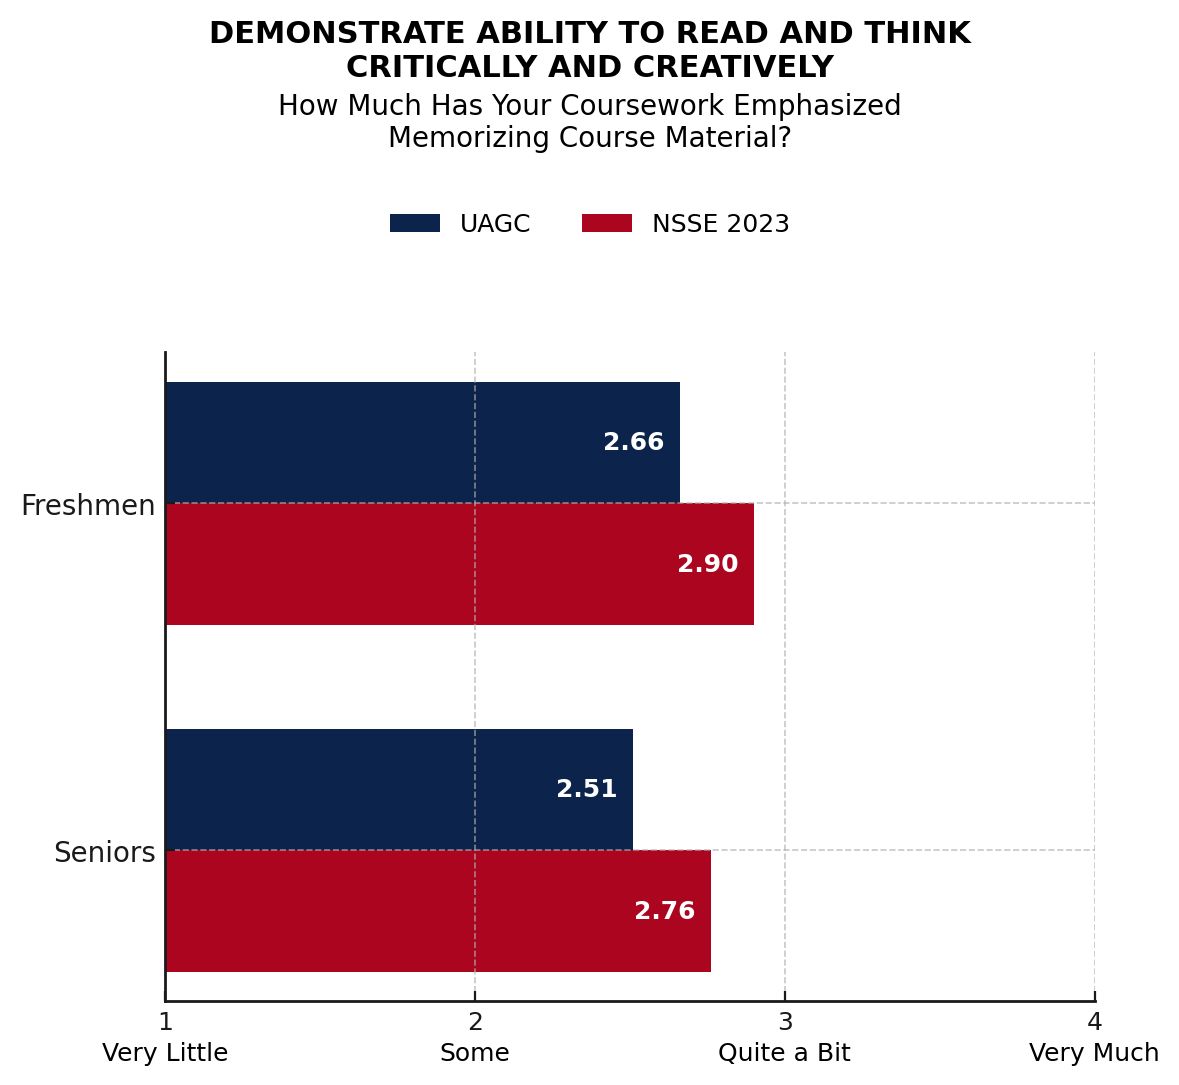
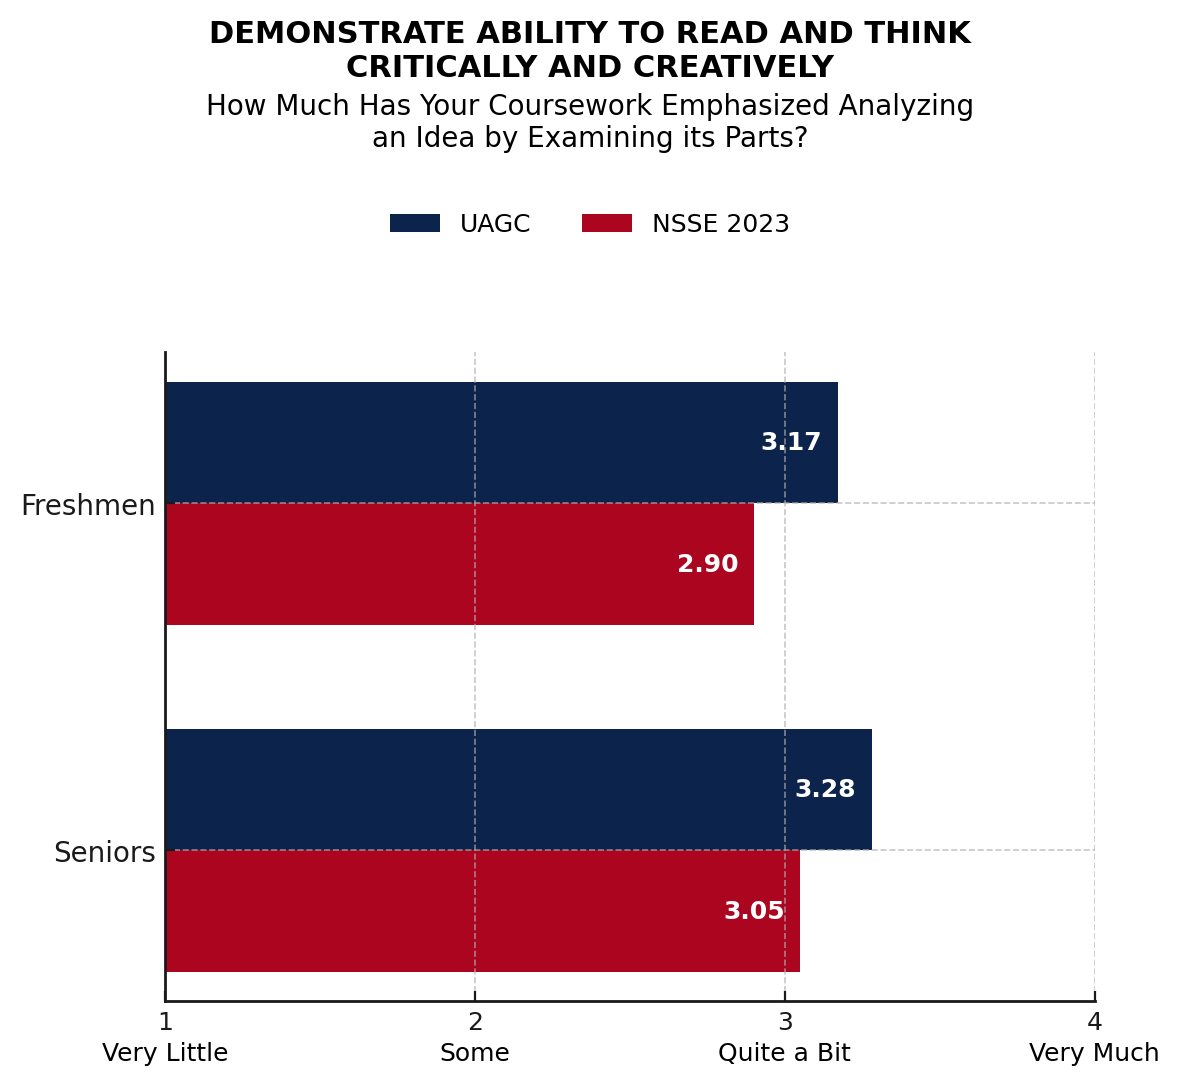
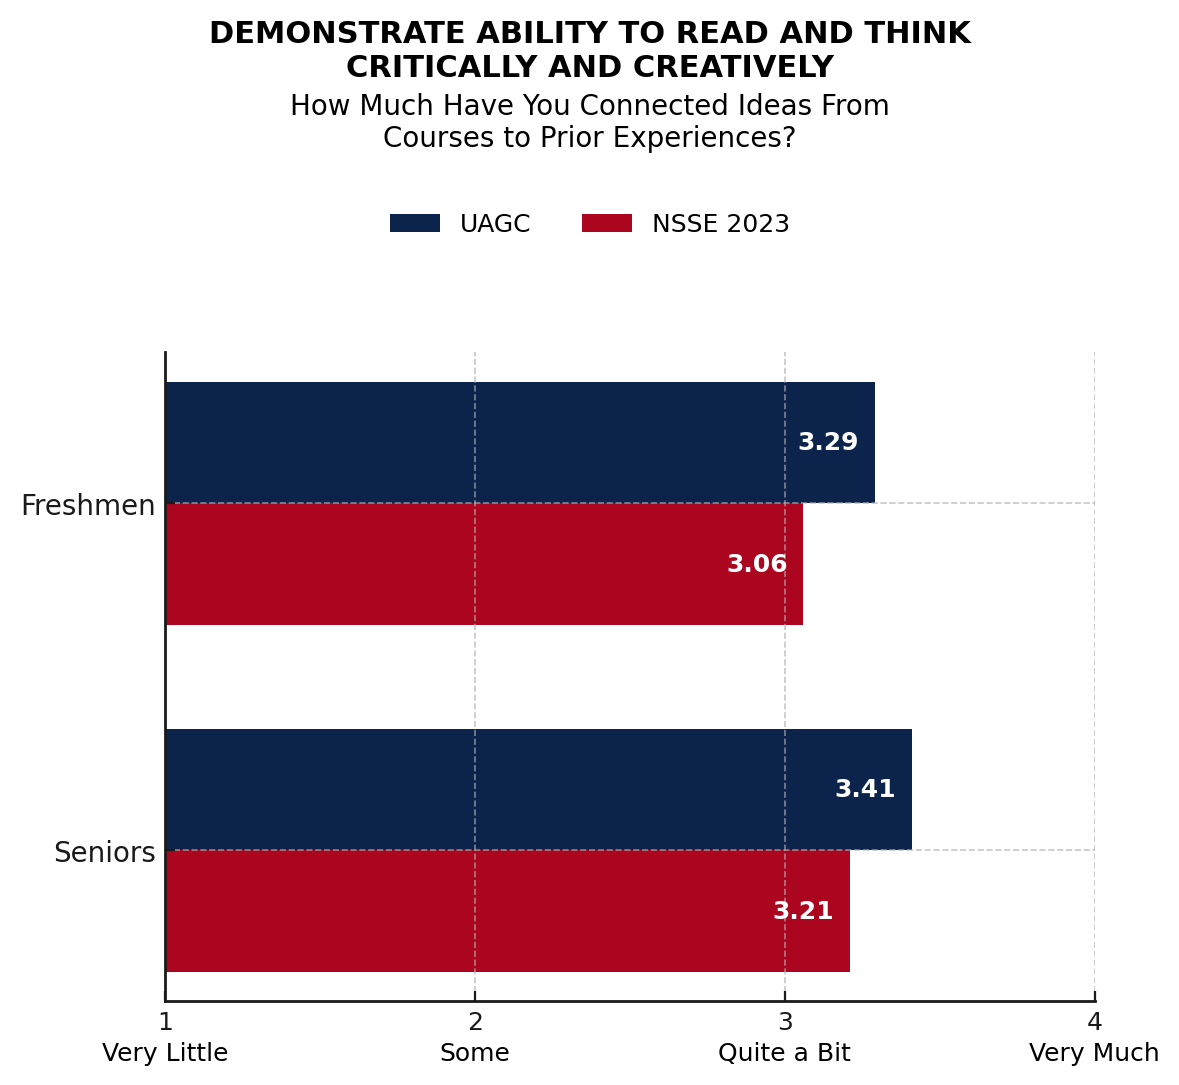
Demonstrate ability to read and think critically and creatively
Demonstrating the ability to read and think critically and creatively are strengths of University of Arizona Global Campus students. Responding University of Arizona Global Campus students report a significantly higher propensity to critically evaluate the strengths and weaknesses of their own views and participate in class discussions over national NSSE averages. Similarly, students indicate they work on papers or projects that utilize ideas and information from various sources more frequently than the national average. The University of Arizona Global Campus students also report a greater emphasis on the use of critical thinking components within coursework when compared to national norms. These include: analyzing, synthesizing, and making value judgments with regards to ideas and information.
The University of Arizona Global Campus students report a lower need to memorize facts, ideas, or methods from their courses. This result may not necessarily be negative. Less emphasis is given to lower level cognitive skills such as memorizing because facts and figures are rapidly changing, and facts memorized today may not be relevant tomorrow. In the University of Arizona Global Campus classes, more emphasis is focused on developing higher level cognitive skills such as analyzing and synthesizing information so students can apply thought processes and patterns to solve problems across multiple scenarios.
The University of Arizona Global Campus students have many opportunities to develop their critical thinking and creative skills as they are required to consistently contribute their views in discussion posts and assignments, and support them with valid research. All University of Arizona Global Campus courses include assignments that promote analysis, with final course assignments and capstone courses supporting students' synthesis of information and ideas.
See Critical Thinking tab below.
-
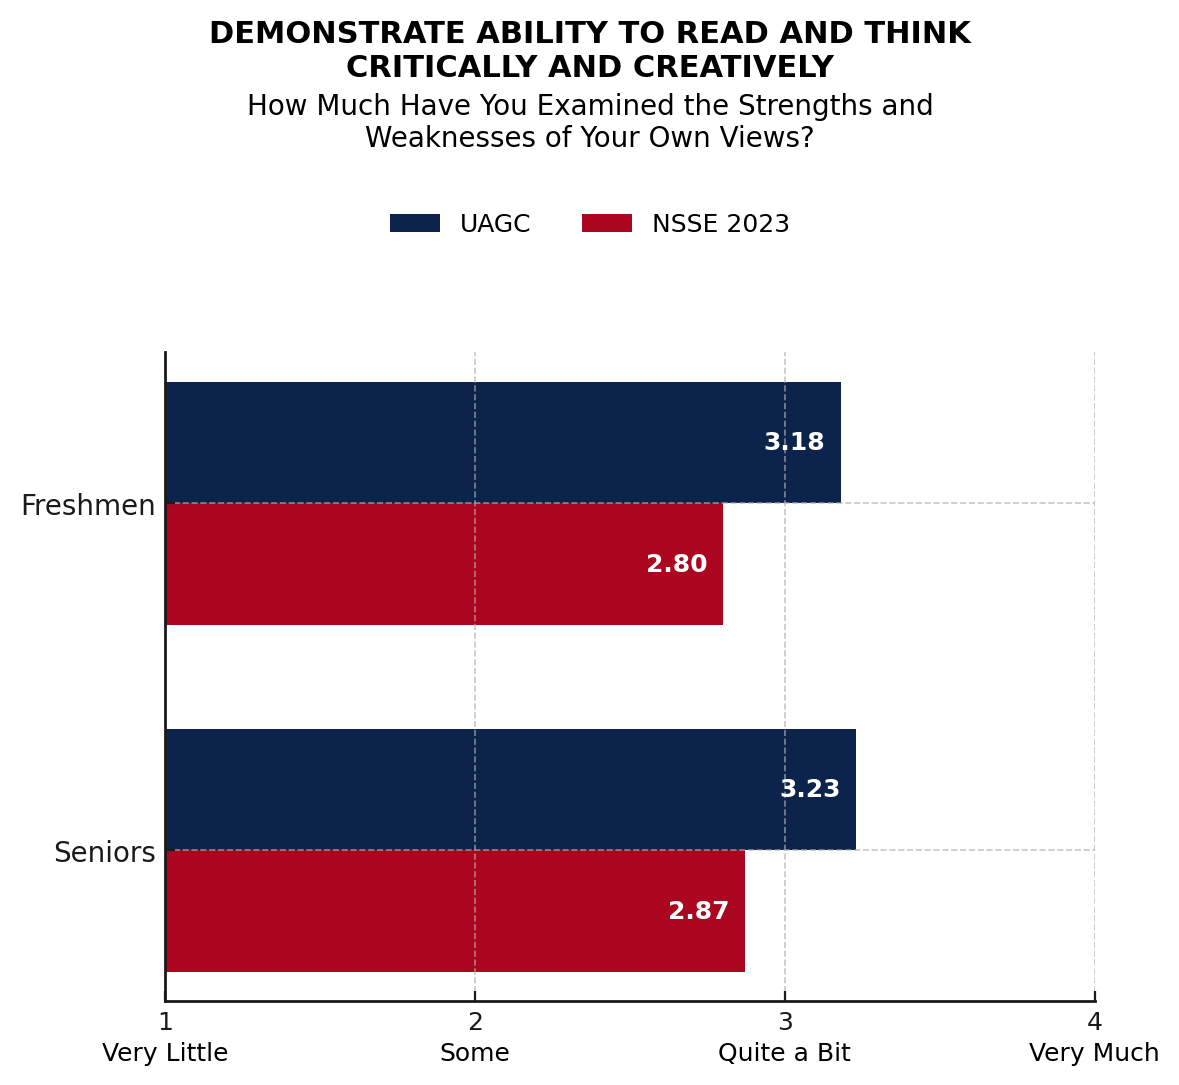
A. During the current school year, about how often have you done each of the following?
Scale: 1 = Never, 2 = Sometimes, 3 = Often, 4 = Very oftenSource: Office of Institutional Effectiveness, 2023
NOTE: March-May 2023 survey of 8,106 University of Arizona Global Campus first-year (FY) and senior (SR) students (FY=3,405; SR=4,701). Sample size obtained: 1,535. Overall response rate: 19%. -
B. During the current school year, about how often have you done each of the following?
Scale: 1 = Never, 2 = Sometimes, 3 = Often, 4 = Very oftenSource: Office of Institutional Effectiveness, 2023
NOTE: March-May 2023 survey of 8,106 University of Arizona Global Campus first-year (FY) and senior (SR) students (FY=3,405; SR=4,701). Sample size obtained: 1,535. Overall response rate: 19%. -
C. During the current school year, how much has your coursework emphasized the following?
Scale: 1 = Very little, 2 = Some, 3 = Quite a bit, 4 = Very muchSource: Office of Institutional Effectiveness, 2023
NOTE: March-May 2023 survey of 8,106 University of Arizona Global Campus first-year (FY) and senior (SR) students (FY=3,405; SR=4,701). Sample size obtained: 1,535. Overall response rate: 19%. -
D. During the current school year, how much has your coursework emphasized the following?
Scale: 1 = Very little, 2 = Some, 3 = Quite a bit, 4 = Very muchSource: Office of Institutional Effectiveness, 2023
NOTE: March-May 2023 survey of 8,106 University of Arizona Global Campus first-year (FY) and senior (SR) students (FY=3,405; SR=4,701). Sample size obtained: 1,535. Overall response rate: 19%. -
E. During the current school year, how much has your coursework emphasized the following?
Scale: 1 = Very little, 2 = Some, 3 = Quite a bit, 4 = Very muchSource: Office of Institutional Effectiveness, 2023
NOTE: March-May 2023 survey of 8,106 University of Arizona Global Campus first-year (FY) and senior (SR) students (FY=3,405; SR=4,701). Sample size obtained: 1,535. Overall response rate: 19%. -
F. During the current school year, about how often have you done each of the following?
Scale: 1 = Never, 2 = Sometimes, 3 = Often, 4 = Very oftenSource: Office of Institutional Effectiveness, 2023
NOTE: March-May 2023 survey of 8,106 University of Arizona Global Campus first-year (FY) and senior (SR) students (FY=3,405; SR=4,701). Sample size obtained: 1,535. Overall response rate: 19%.
Service directed at meeting the needs of others
While responding University of Arizona Global Campus students report significantly more time spent caring for dependents living with them, they also report a significantly higher likelihood to contribute to community service and volunteerism. The University of Arizona Global Campus creates a culture of community engagement and service through its sponsorship of university-wide programs for faculty, staff, students, and alumni that foster community involvement. One such effort is the Sharing Time and Resources (S.T.A.R) program, administered through Student Affairs. The mission of the S.T.A.R. program is to collaborate with community partners in order to connect students with their local, national, and global communities for the purpose of contributing to the public good through volunteering, internships, on-the-job training, professional development, and networking opportunities. Through these activities, the S.T.A.R. program seeks to educate students regarding critical societal issues and challenges, and to provide structured opportunities for reflection designed to promote their learning and development.
See Volunteerism tab below.
-
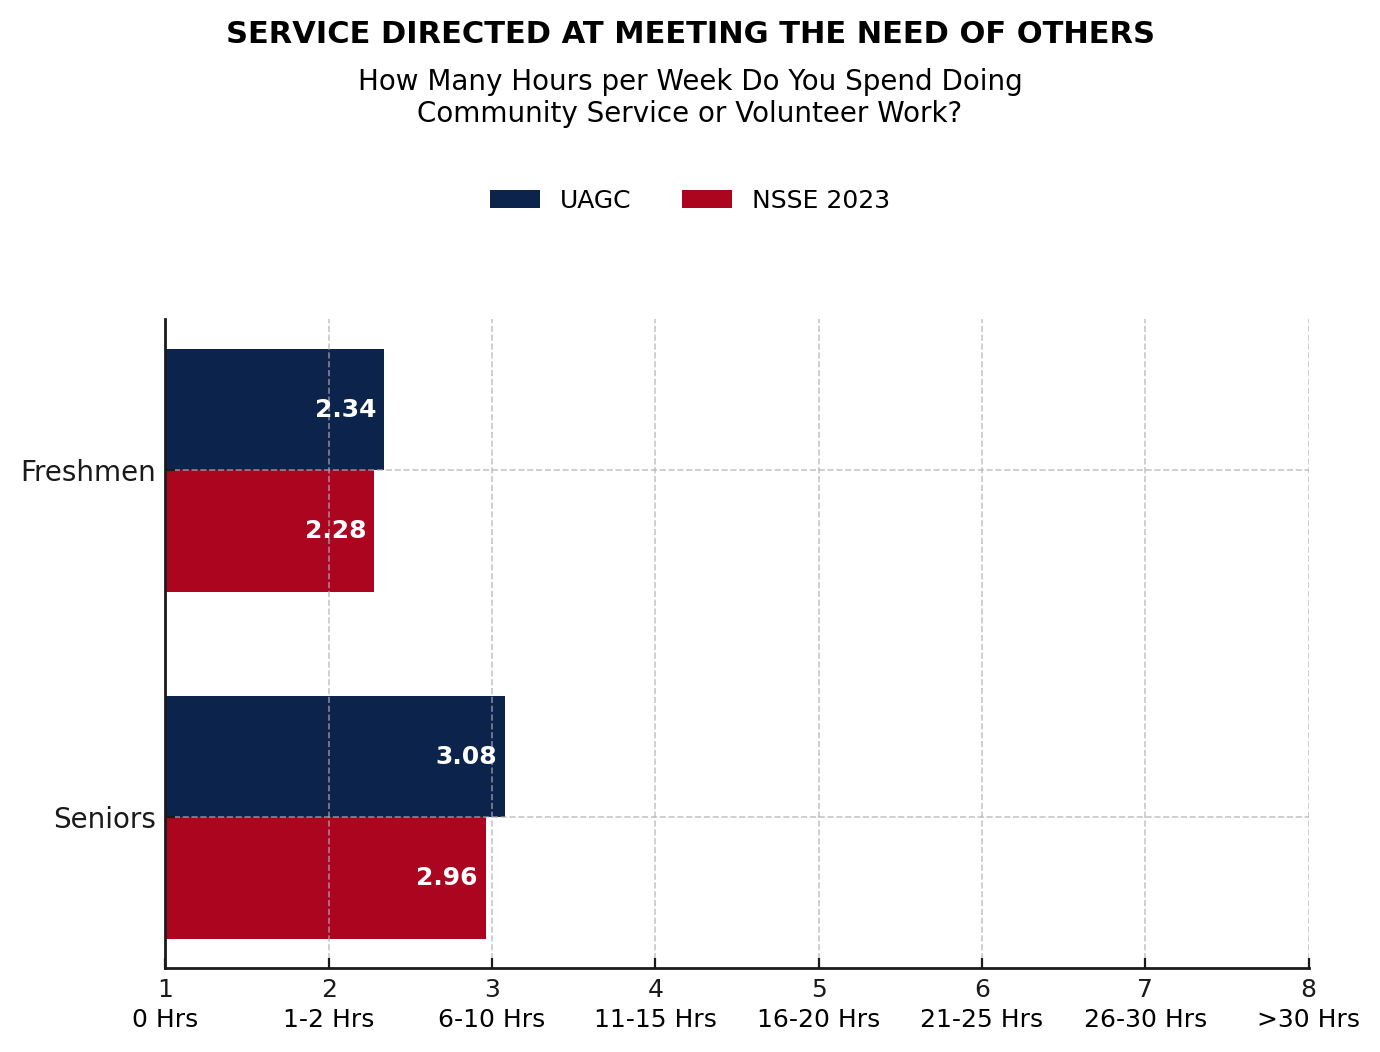
A. About how many hours do you spend in a typical 7-day week doing the following?
Scale: 1 = 0 hrs/wk, 2 = 1-5 hrs/wk, 3 = 6-10 hrs/wk, 4 = 11-15 hrs/wk, 5 = 16-20 hrs/wk, 6 = 21-25 hrs/wk, 7 = 26-30 hrs/wk, 8 = More than 30 hrs/wk. Variables recoded by NSSE to estimate number of hours per week.Source: Office of Institutional Effectiveness, 2023
NOTE: March-May 2023 survey of 8,106 University of Arizona Global Campus first-year (FY) and senior (SR) students (FY=3,405; SR=4,701). Sample size obtained: 1,535. Overall response rate: 19%. -
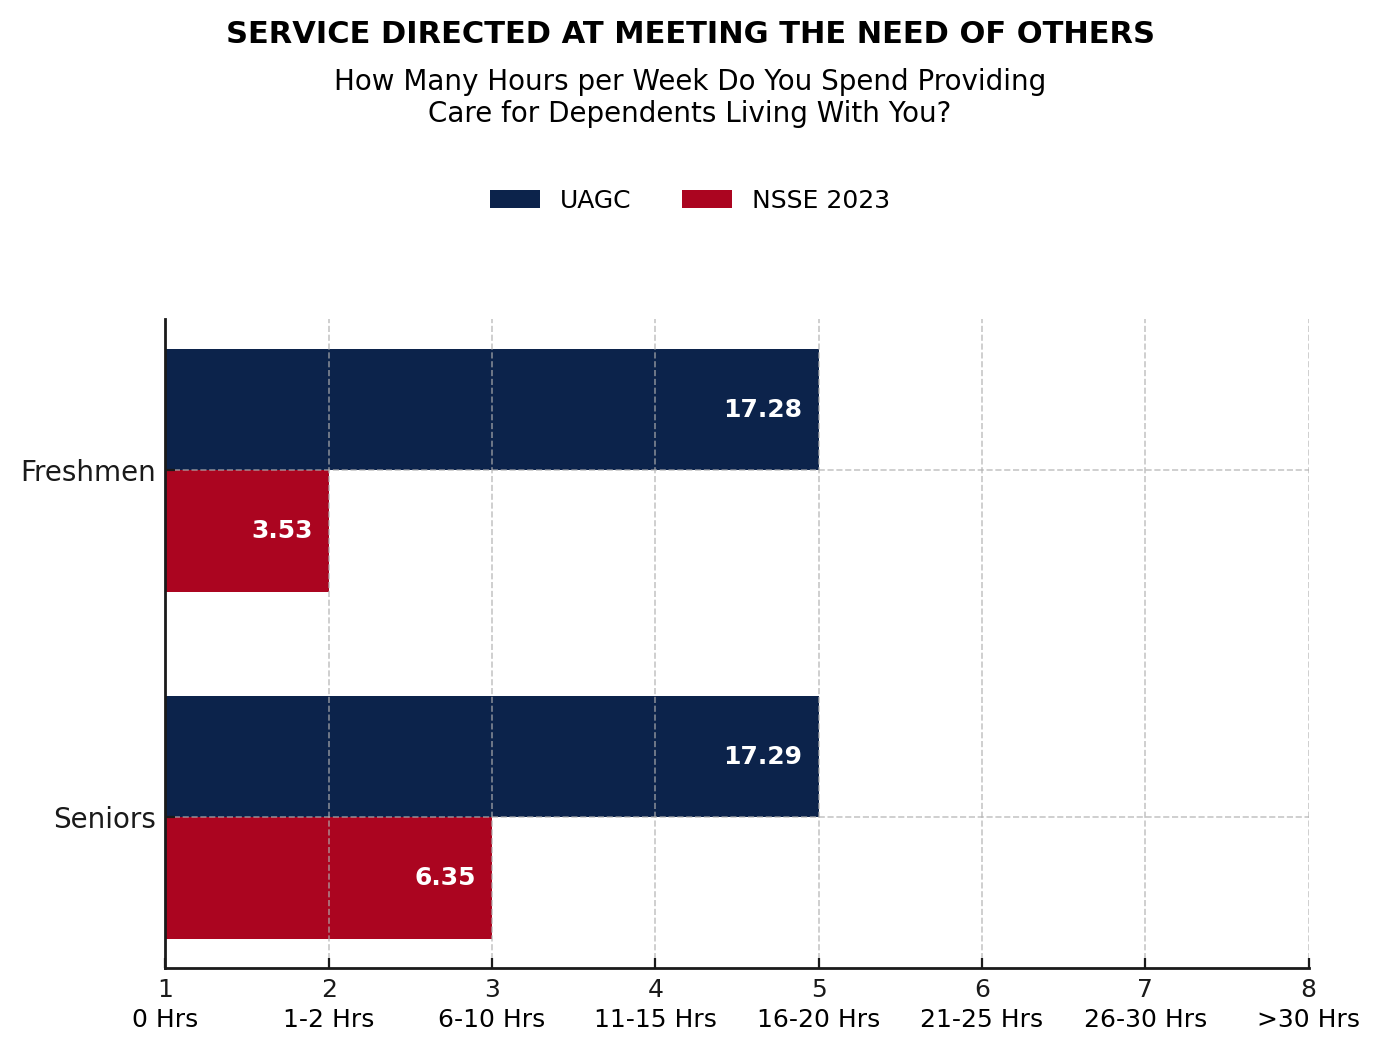
B. About how many hours do you spend in a typical 7-day week doing the following?
Scale: 1 = 0 hrs/wk, 2 = 1-5 hrs/wk, 3 = 6-10 hrs/wk, 4 = 11-15 hrs/wk, 5 = 16-20 hrs/wk, 6 = 21-25 hrs/wk, 7 = 26-30 hrs/wk, 8 = More than 30 hrs/wk. Variables recoded by NSSE to estimate number of hours per week.Source: Office of Institutional Effectiveness, 2023
NOTE: March-May 2023 survey of 8,106 University of Arizona Global Campus first-year (FY) and senior (SR) students (FY=3,405; SR=4,701). Sample size obtained: 1,535. Overall response rate: 19%.
Synthesize proficiencies appropriate to the degree level and discipline
Responding University of Arizona Global Campus students indicate The University of Arizona Global Campus has contributed to their development in evaluating a point of view, decision, or information source at a higher rate than the national comparison group. At the senior level, students indicate that the University of Arizona Global Campus has contributed to their development in applying facts, theories, or methods to practical problems or new situations and analyzing an idea, experience or line of reasoning in depth by examining its parts at a higher rate than the national comparison group whereas at the freshmen level, the two groups’ perceptions are the same.
See Synthesize Proficiencies tab below.
-
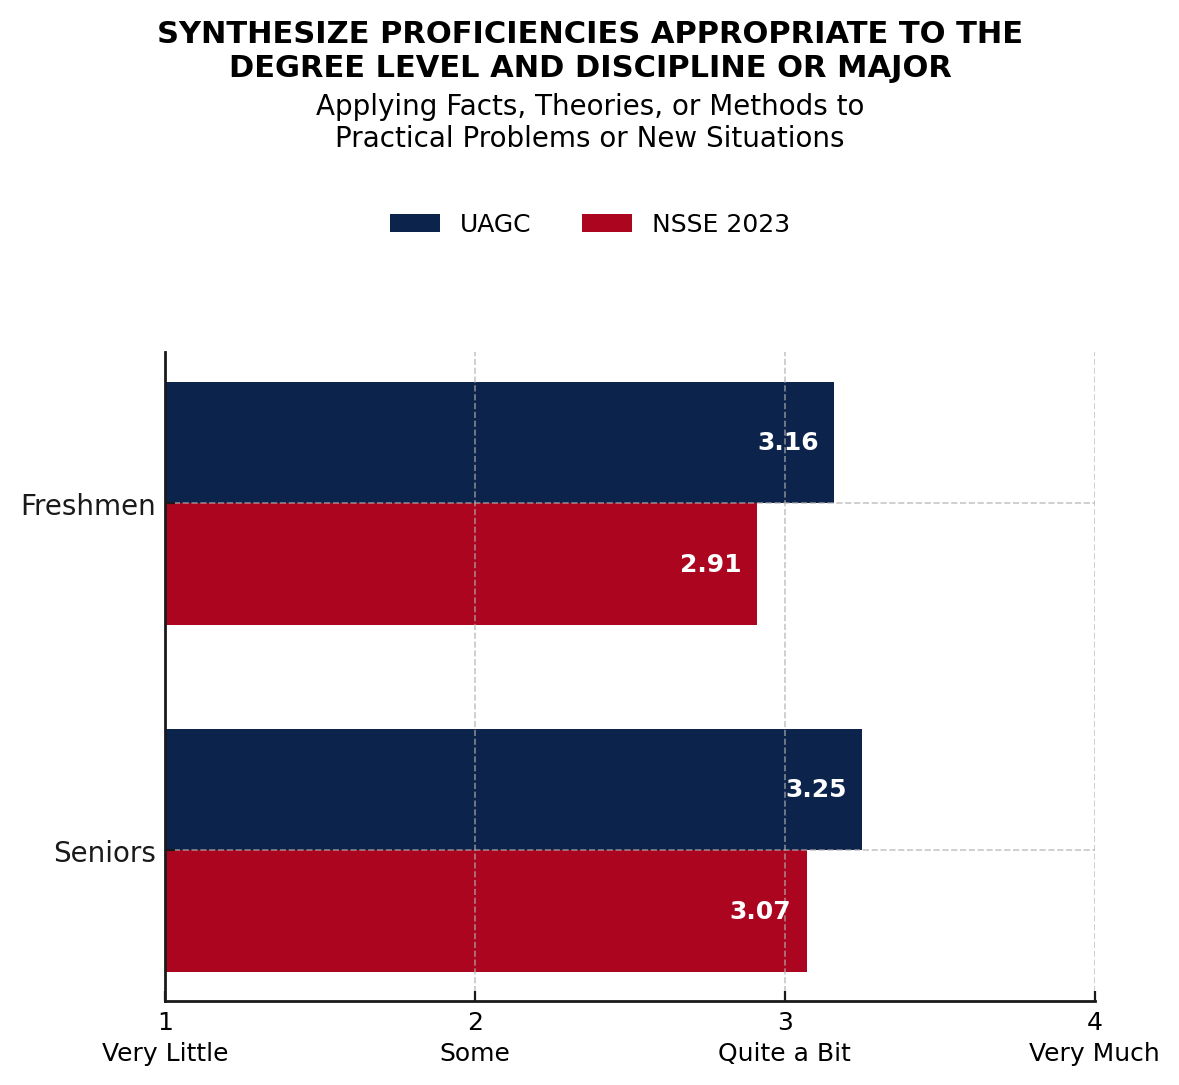
A. Applying facts, theories, or methods to practical problems or new situations
Scale: 1 = Very little, 2 = Some, 3 = Quite a bit, 4 = Very muchSource: Office of Institutional Effectiveness, 2023
NOTE: March-May 2023 survey of 8,106 University of Arizona Global Campus first-year (FY) and senior (SR) students (FY=3,405; SR=4,701). Sample size obtained: 1,535. Overall response rate: 19%. -

B. Analyzing an idea, experience, or line of reasoning in depth by examining its parts
Scale: 1 = Very little, 2 = Some, 3 = Quite a bit, 4 = Very muchSource: Office of Institutional Effectiveness, 2023
NOTE: March-May 2023 survey of 8,106 University of Arizona Global Campus first-year (FY) and senior (SR) students (FY=3,405; SR=4,701). Sample size obtained: 1,535. Overall response rate: 19%. -
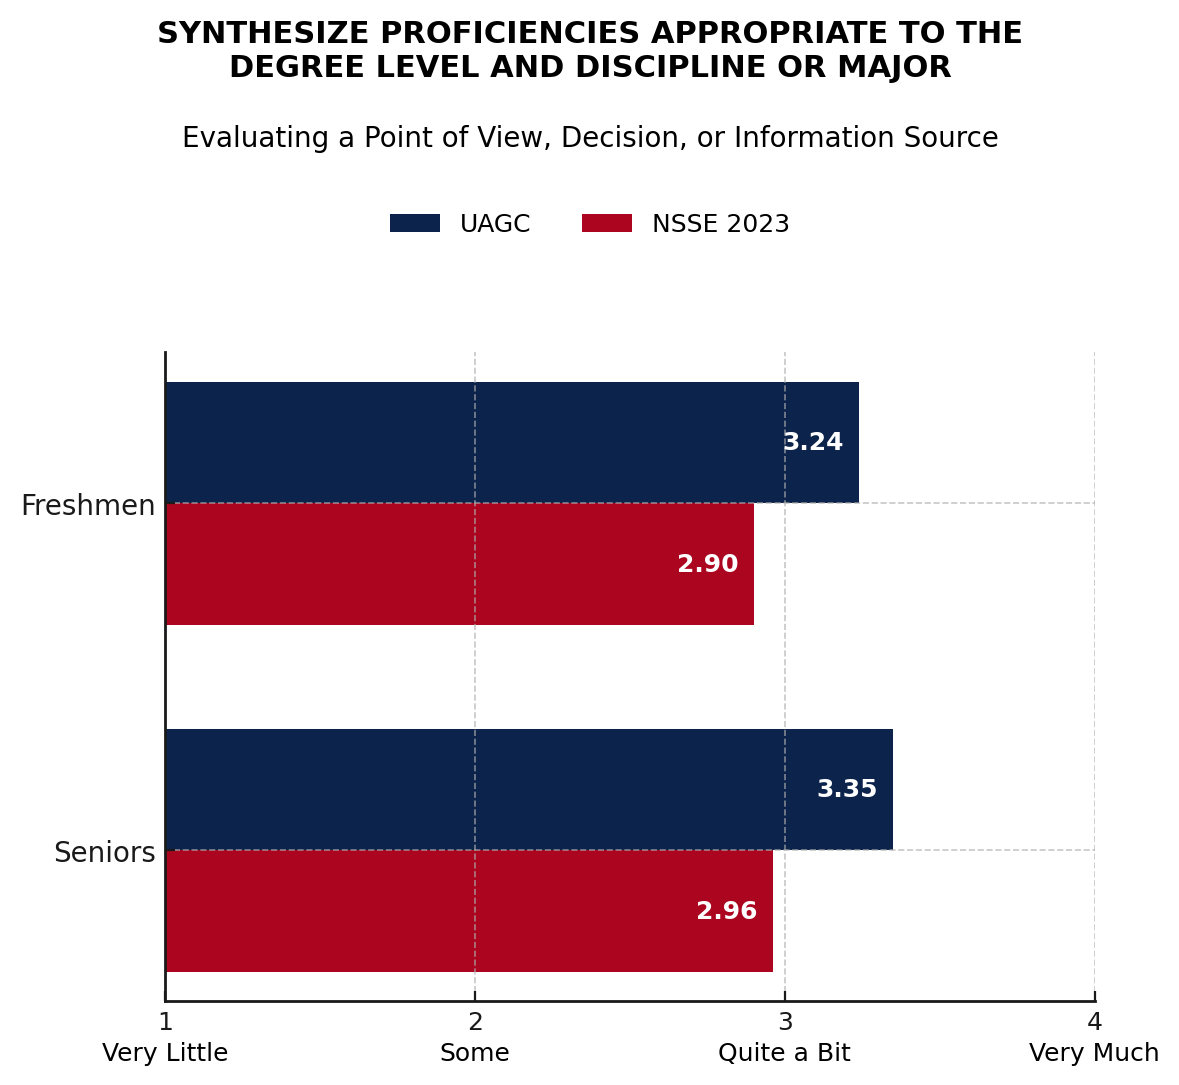
C. Evaluating a point of view, decision, or information source
Scale: 1 = Very little, 2 = Some, 3 = Quite a bit, 4 = Very muchSource: Office of Institutional Effectiveness, 2023
NOTE: March-May 2023 survey of 8,106 University of Arizona Global Campus first-year (FY) and senior (SR) students (FY=3,405; SR=4,701). Sample size obtained: 1,535. Overall response rate: 19%.
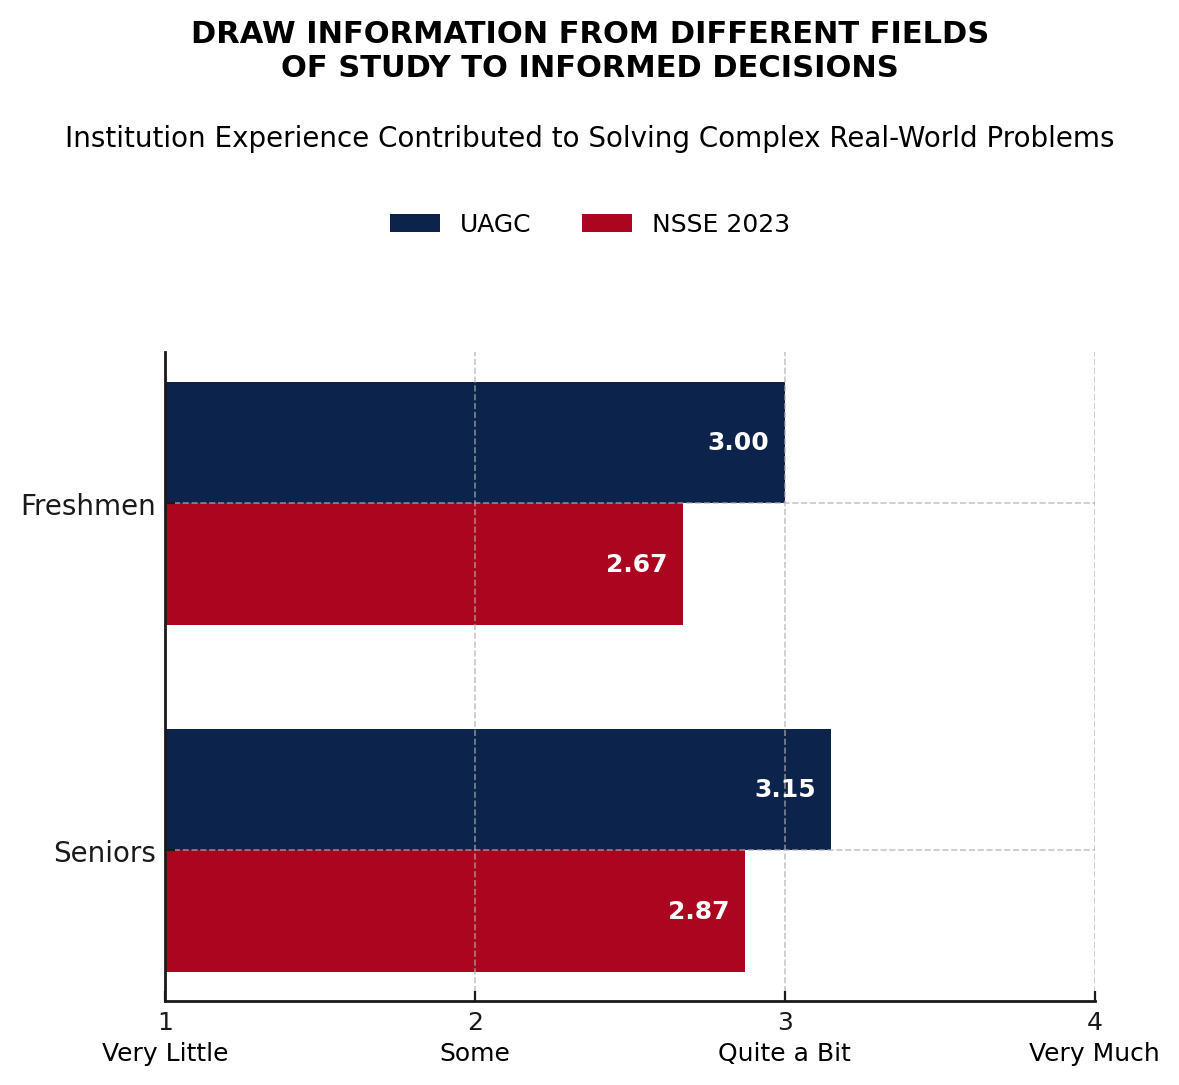
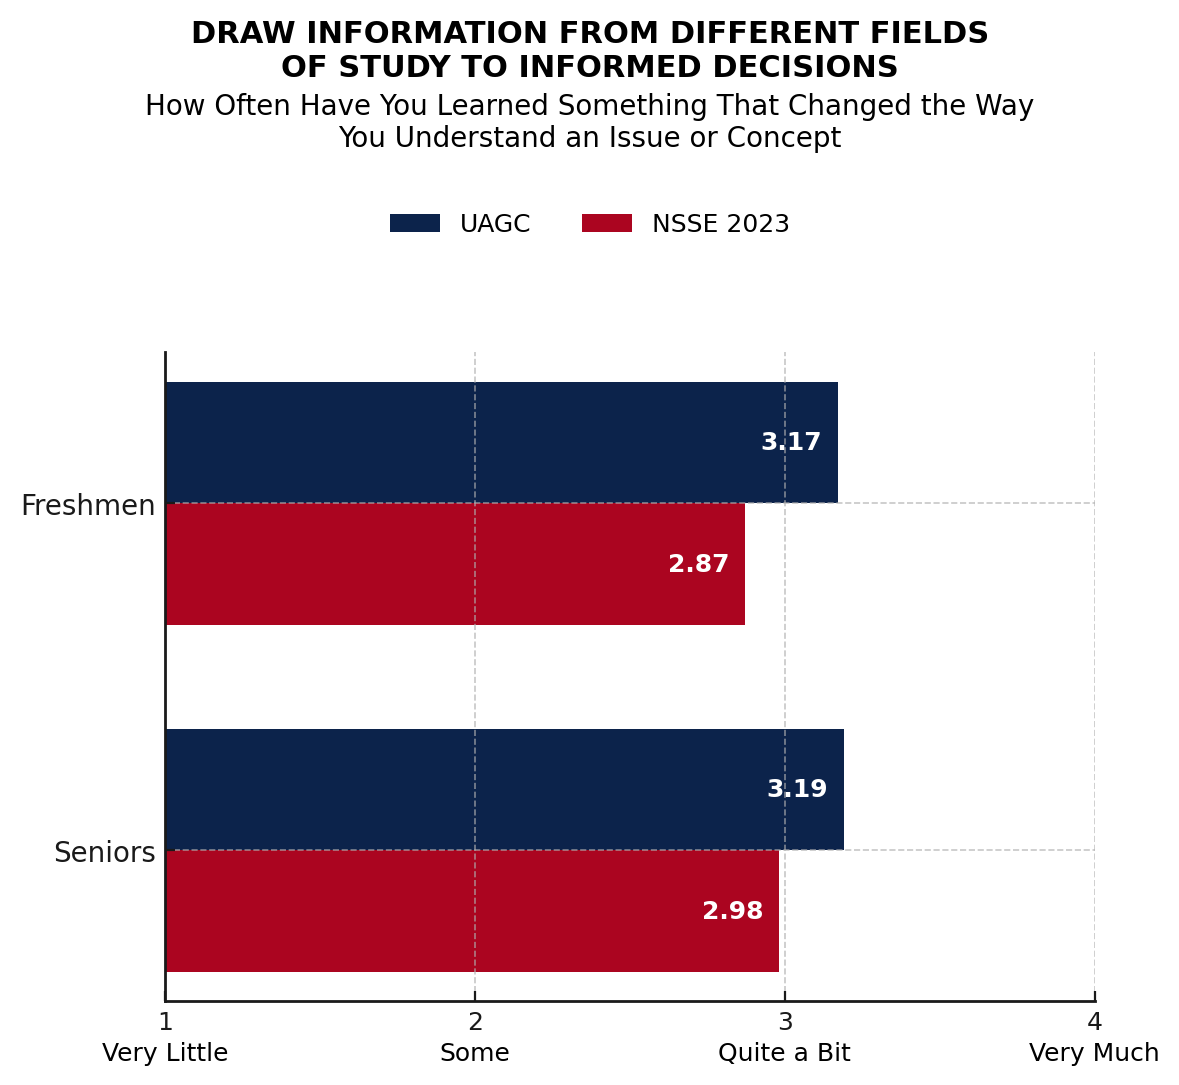
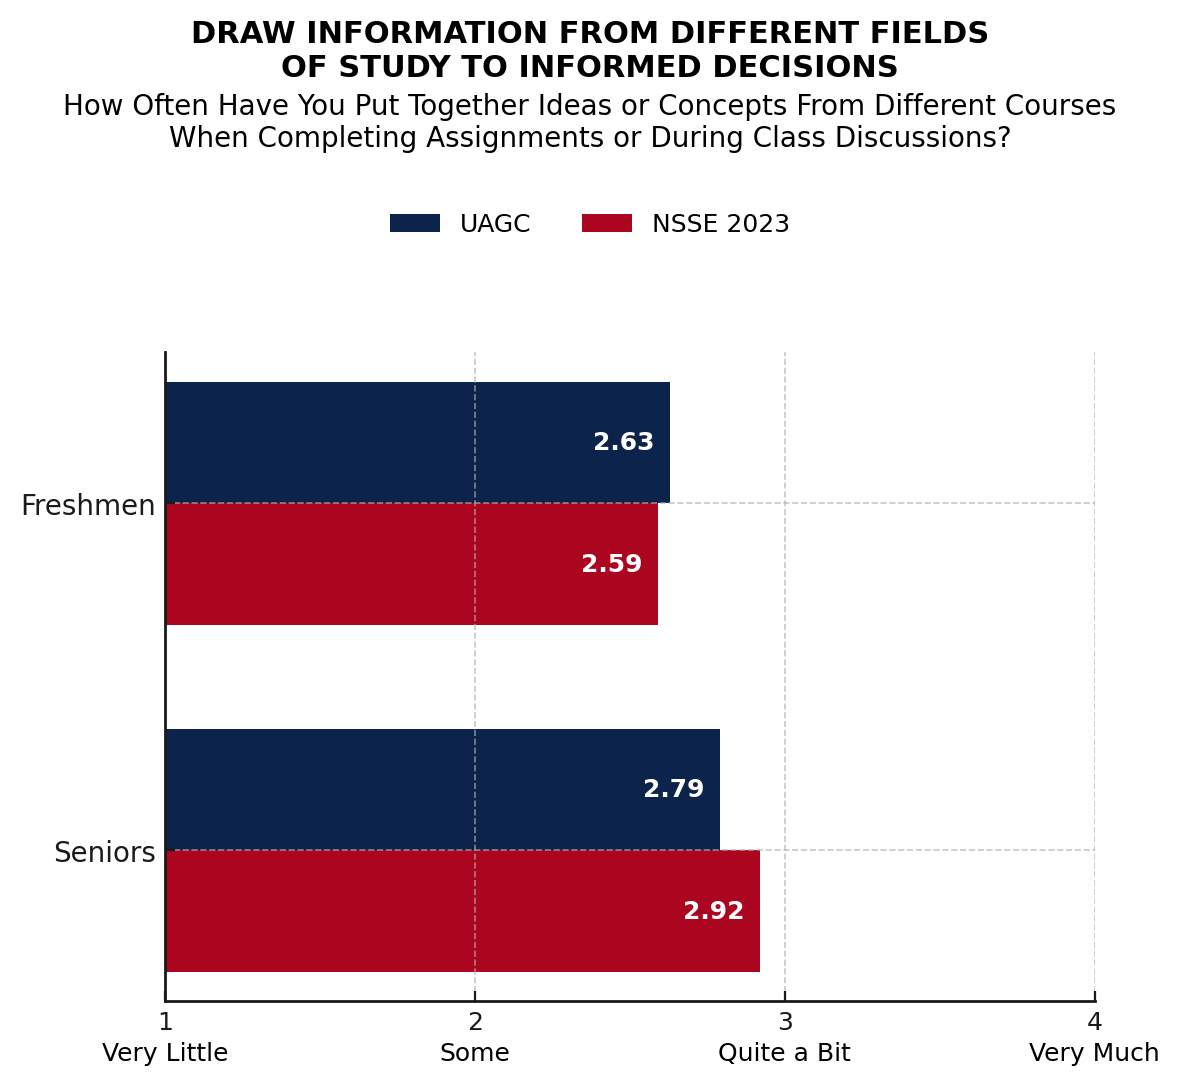
Draw information from different fields of study to make informed decisions
Responding University of Arizona Global Campus students indicate the University of Arizona Global Campus has contributed to their development in solving real-world problems at a higher rate than the national comparison group. Similarly, students report having learned something that changed the way they understand an issue or concept at a higher rate than the comparison group. At the University of Arizona Global Campus, learning activities are incorporated into courses that help students construct knowledge by integrating personal experiences with new learning. The University of Arizona Global Campus freshmen and senior students report they incorporate what they learn into assignments and discussions for subsequent courses at a slightly lower rate as the national comparison group.
See Decision Making tab below.
-
A. How much has your experience at this institution contributed to your knowledge, skills, and personal development in the following areas?
Scale: 1 = Very little, 2 = Some, 3 = Quite a bit, 4 = Very muchSource: Office of Institutional Effectiveness, 2023
NOTE: March-May 2023 survey of 8,106 University of Arizona Global Campus first-year (FY) and senior (SR) students (FY=3,405; SR=4,701). Sample size obtained: 1,535. Overall response rate: 19%. -
B. During the current school year, about how often have you done each of the following?
Scale: 1 = Never, 2 = Sometimes, 3 = Often, 4 = Very oftenSource: Office of Institutional Effectiveness, 2023
NOTE: March-May 2023 survey of 8,106 University of Arizona Global Campus first-year (FY) and senior (SR) students (FY=3,405; SR=4,701). Sample size obtained: 1,535. Overall response rate: 19%. -
C. During the current school year, about how often have you done each of the following?
Scale: 1 = Never, 2 = Sometimes, 3 = Often, 4 = Very oftenSource: Office of Institutional Effectiveness, 2023
NOTE: March-May 2023 survey of 8,106 University of Arizona Global Campus first-year (FY) and senior (SR) students (FY=3,405; SR=4,701). Sample size obtained: 1,535. Overall response rate: 19%.
Construct ethical responses to contemporary issues
Responding University of Arizona Global Campus students indicate the University of Arizona Global Campus has contributed to their development in examining the strengths and weaknesses of their own perspectives at a higher rate than the national comparison group. Similarly, students report having learned something that changed the way they understand an issue or concept at a higher rate than the comparison group. At the University of Arizona Global Campus, learning activities are incorporated into courses that help students connect their learning to societal problems and issues. At the senior level, students indicate that the University of Arizona Global Campus has helped make this connection at a higher rate than the national comparison group whereas at the freshmen level, the two groups’ perceptions of learning is the same.
See Ethical Responses tab below.
-
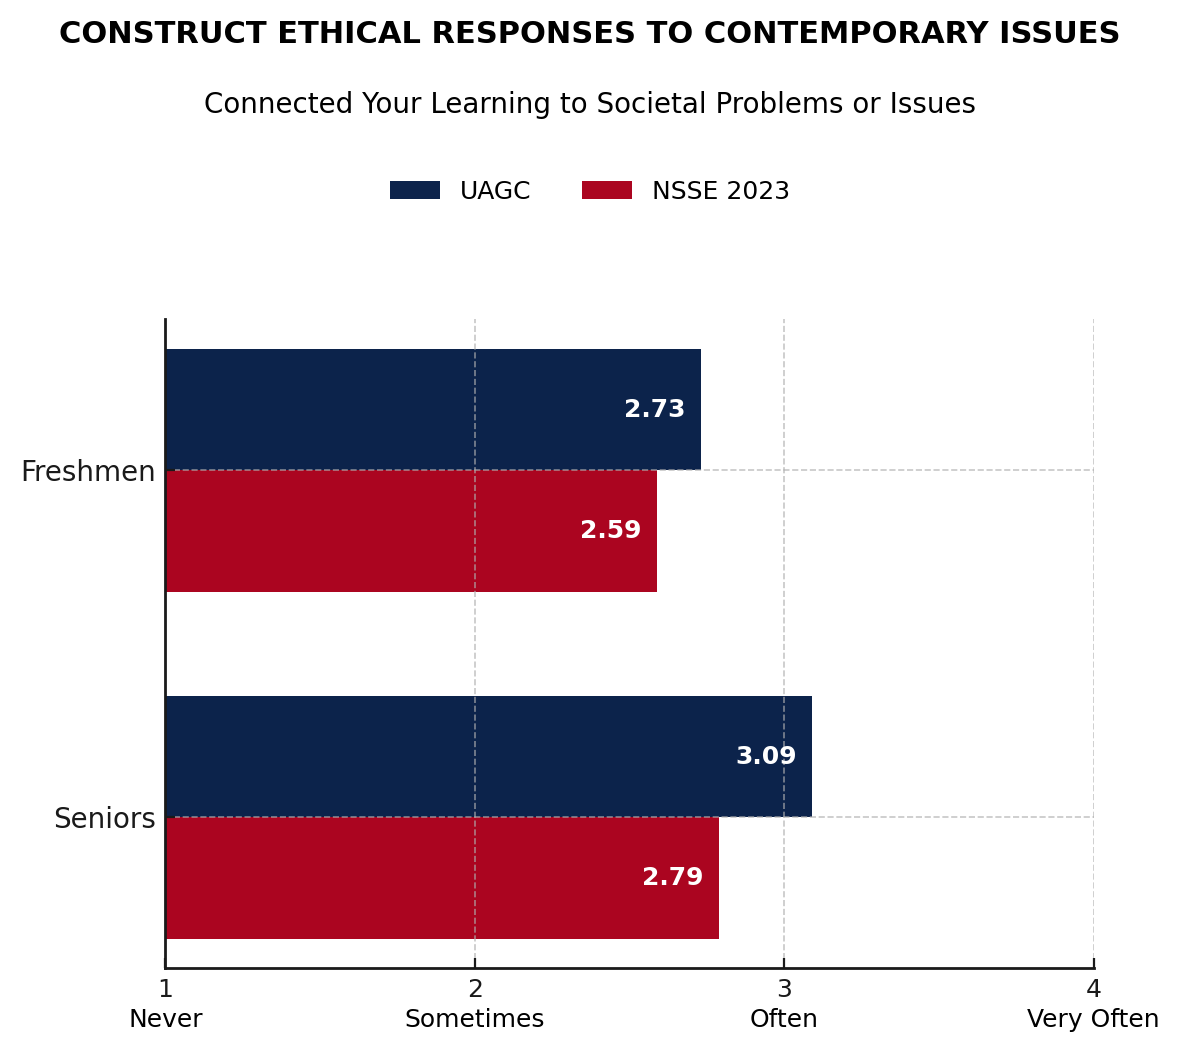
A. Connected your learning to societal problems or issues
Scale: 1 = Never, 2 = Sometimes, 3 = Often, 4 = Very oftenSource: Office of Institutional Effectiveness, 2023
NOTE: March-May 2023 survey of 8,106 University of Arizona Global Campus first-year (FY) and senior (SR) students (FY=3,405; SR=4,701). Sample size obtained: 1,535. Overall response rate: 19%. -
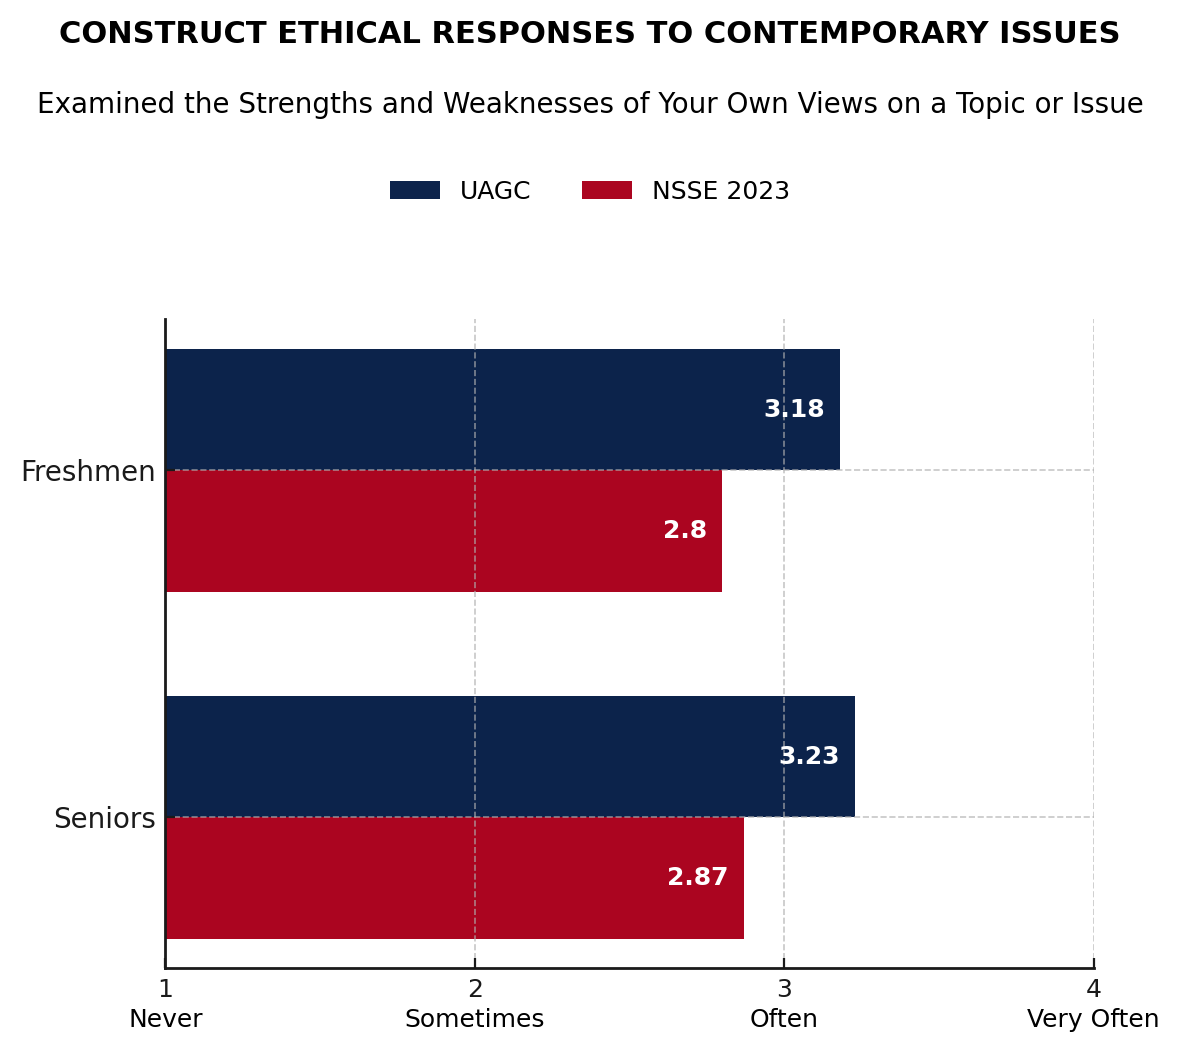
B. Examined the strengths and weaknesses of your own views on a topic or issue
Scale: 1 = Never, 2 = Sometimes, 3 = Often, 4 = Very oftenSource: Office of Institutional Effectiveness, 2023
NOTE: March-May 2023 survey of 8,106 University of Arizona Global Campus first-year (FY) and senior (SR) students (FY=3,405; SR=4,701). Sample size obtained: 1,535. Overall response rate: 19%. -
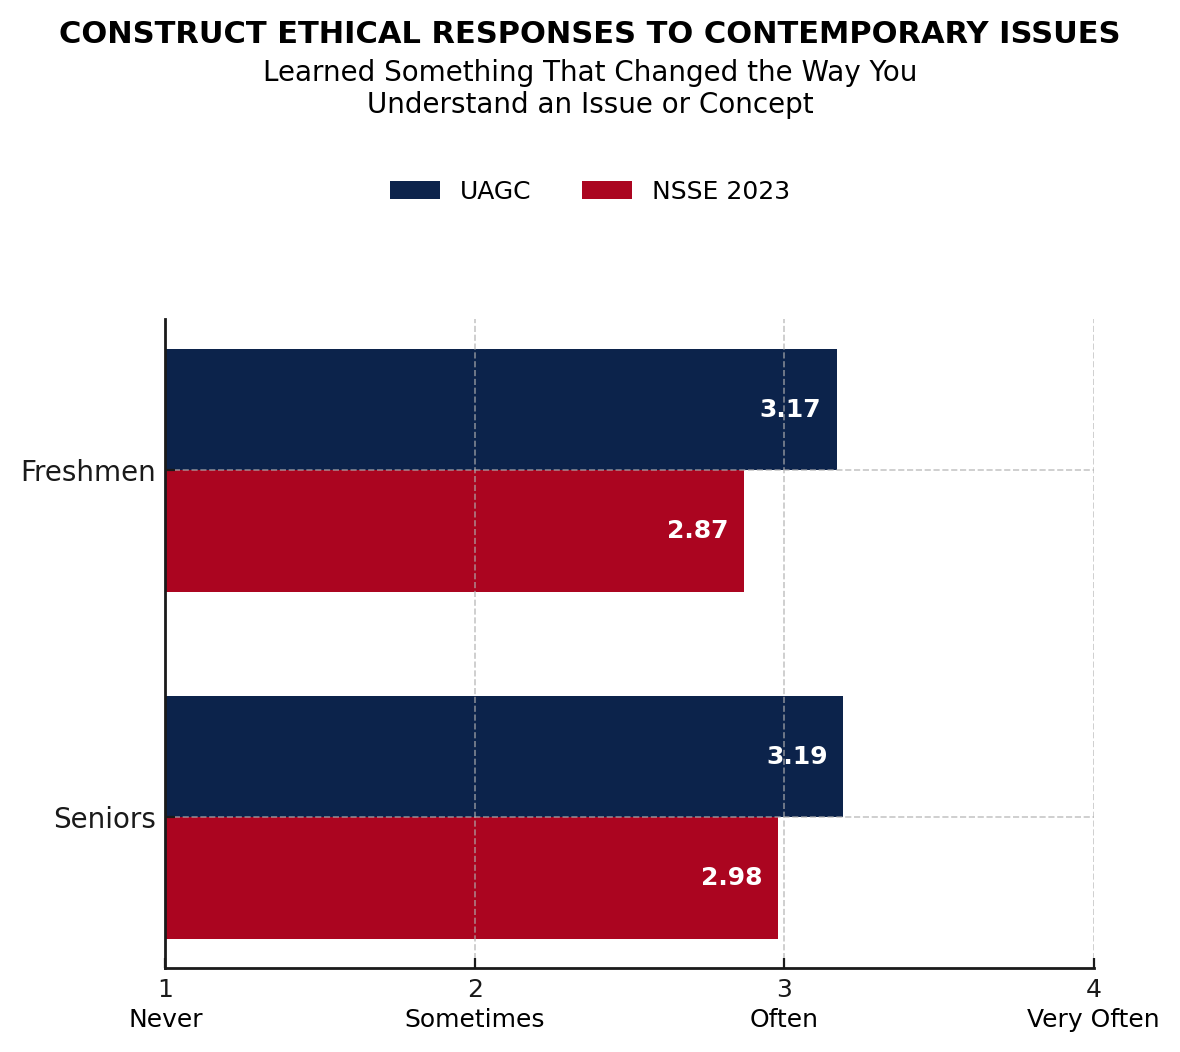
C. Learned something that changed the way you understand an issue or concept
Scale: 1 = Never, 2 = Sometimes, 3 = Often, 4 = Very oftenSource: Office of Institutional Effectiveness, 2023
NOTE: March-May 2023 survey of 8,106 University of Arizona Global Campus first-year (FY) and senior (SR) students (FY=3,405; SR=4,701). Sample size obtained: 1,535. Overall response rate: 19%.
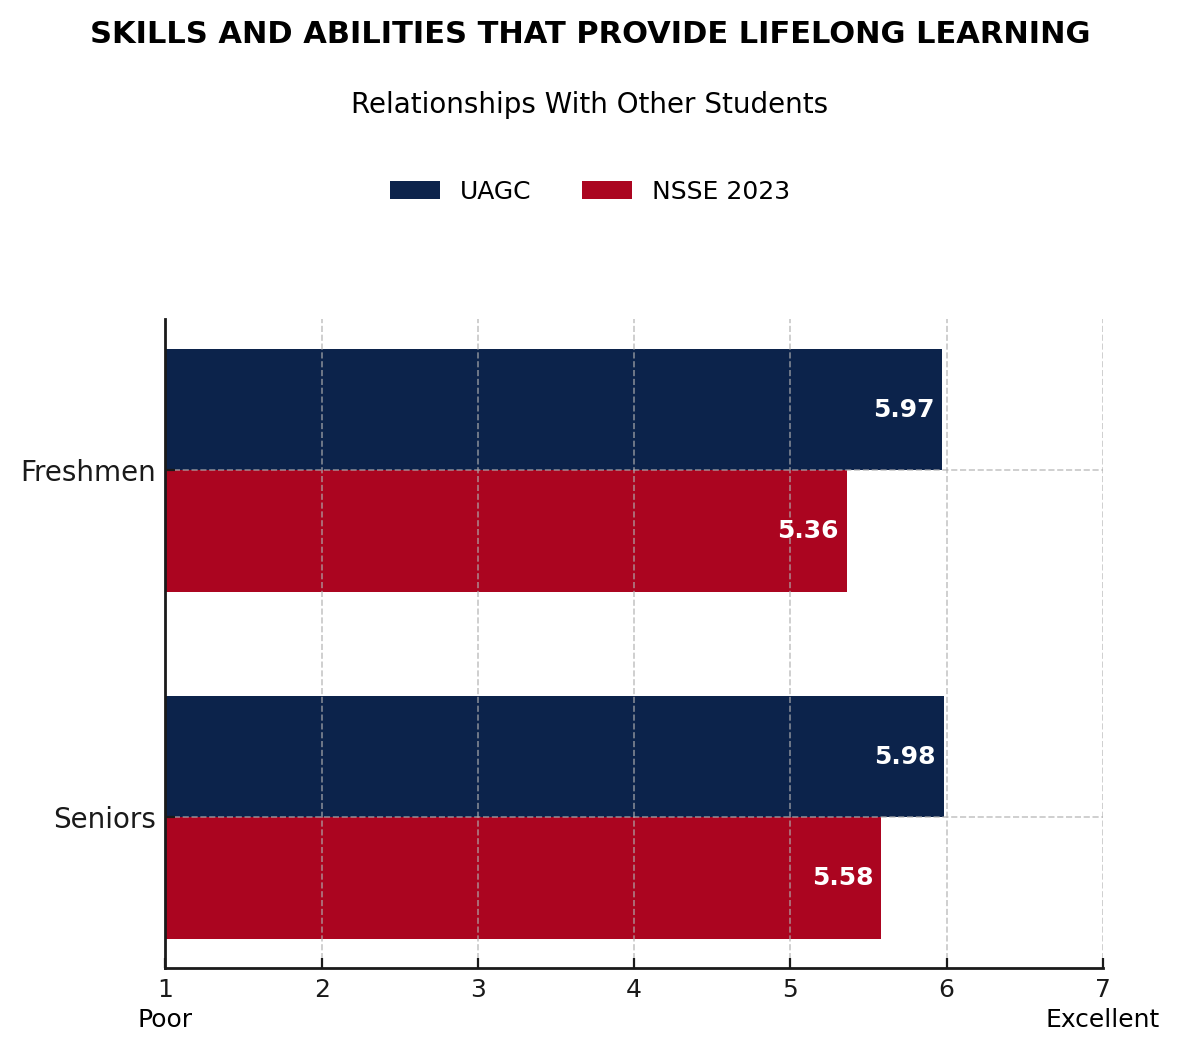
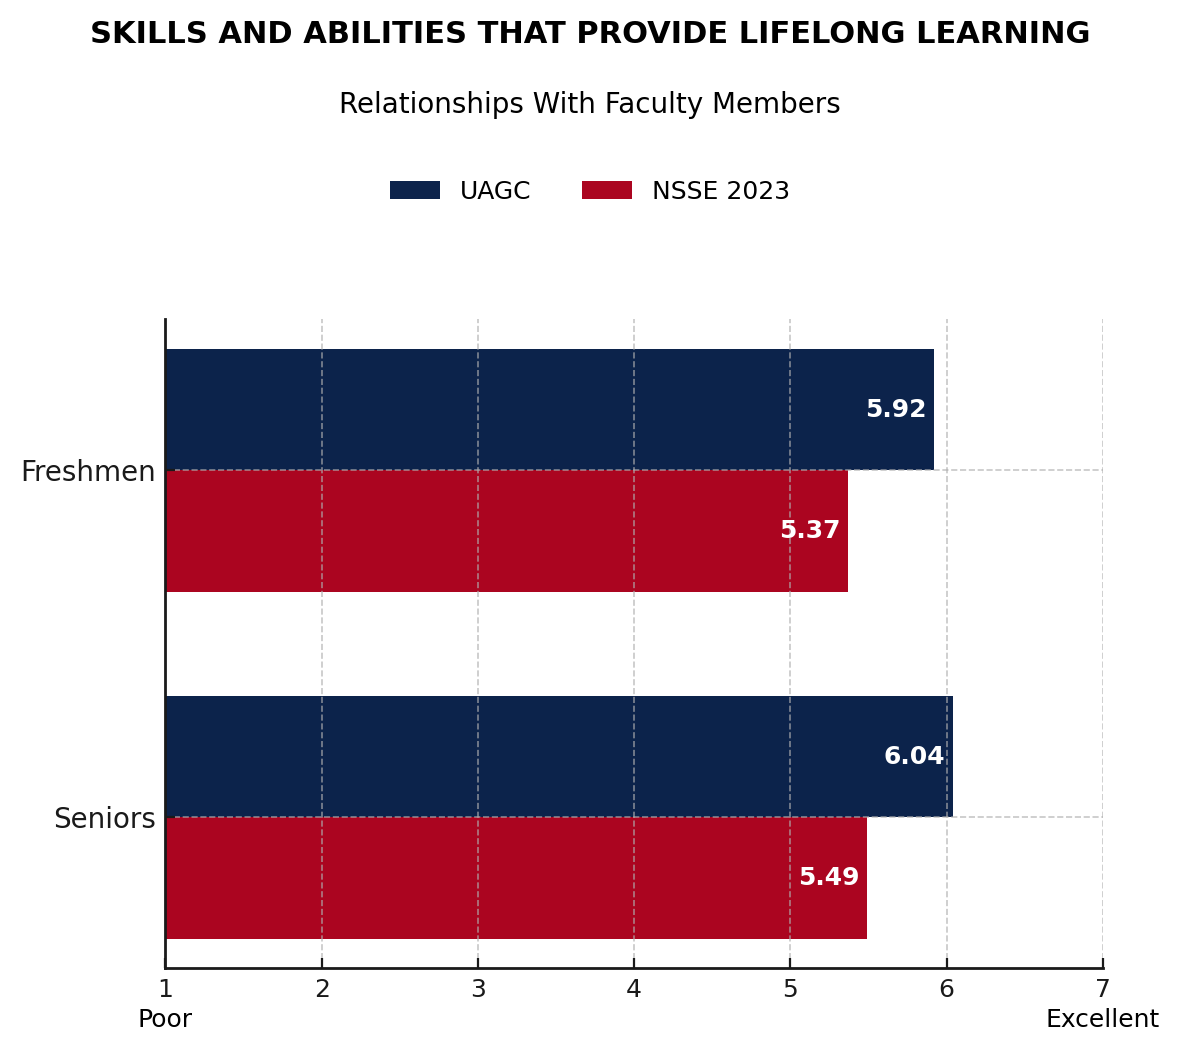
Skills and abilities that provide lifelong learning
Responding University of Arizona Global Campus students report significantly higher propensity to work harder than they thought they could to meet instructor expectations, and report a higher level of contribution from the institution in developing a personal code of ethics.
The University of Arizona Global Campus senior students view relationships with other students, faculty, and student services personnel more positively than University of Arizona Global Campus freshmen and significantly higher than the average for NSSE senior respondents. University of Arizona Global Campus students indicate relatively frequent feedback from faculty on their academic performance. Current resources available for students to build relationships include local area Student and Alumni Networking events, student clubs and organizations, online learning communities and the University of Arizona Global Campus Facebook site. Constructive relationships between students and faculty are facilitated through course communications (discussions, email), as well as an "Ask your instructor" forum. Additionally, Instructional Specialists work with instructors to ensure they are adhering to the University of Arizona Global Campus policies to provide students timely and beneficial feedback.
See Social tab below.
-
A. Indicate the quality of your interactions with the following people at your institution.
Scale: 1 = Poor, to 7 = ExcellentSource: Office of Institutional Effectiveness, 2023
NOTE: March-May 2023 survey of 8,106 University of Arizona Global Campus first-year (FY) and senior (SR) students (FY=3,405; SR=4,701). Sample size obtained: 1,535. Overall response rate: 19%. -
B. Indicate the quality of your interactions with the following people at your institution.
Scale: 1 = Poor, to 7 = ExcellentSource: Office of Institutional Effectiveness, 2023
NOTE: March-May 2023 survey of 8,106 University of Arizona Global Campus first-year (FY) and senior (SR) students (FY=3,405; SR=4,701). Sample size obtained: 1,535. Overall response rate: 19%. -
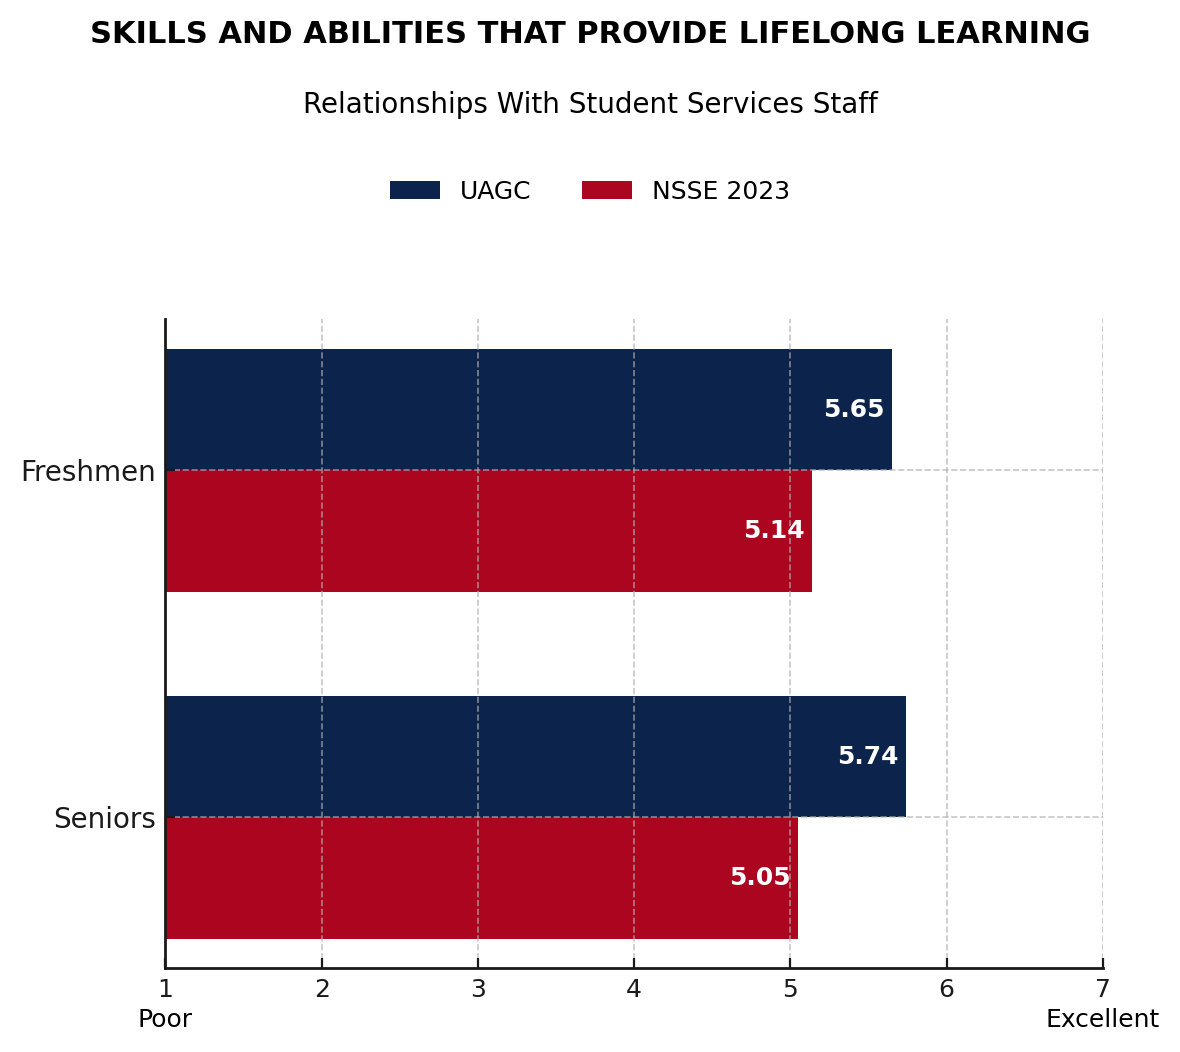
C. Indicate the quality of your interactions with the following people at your institution.
Scale: 1 = Poor, to 7 = ExcellentSource: Office of Institutional Effectiveness, 2023
NOTE: March-May 2023 survey of 8,106 University of Arizona Global Campus first-year (FY) and senior (SR) students (FY=3,405; SR=4,701). Sample size obtained: 1,535. Overall response rate: 19%. -
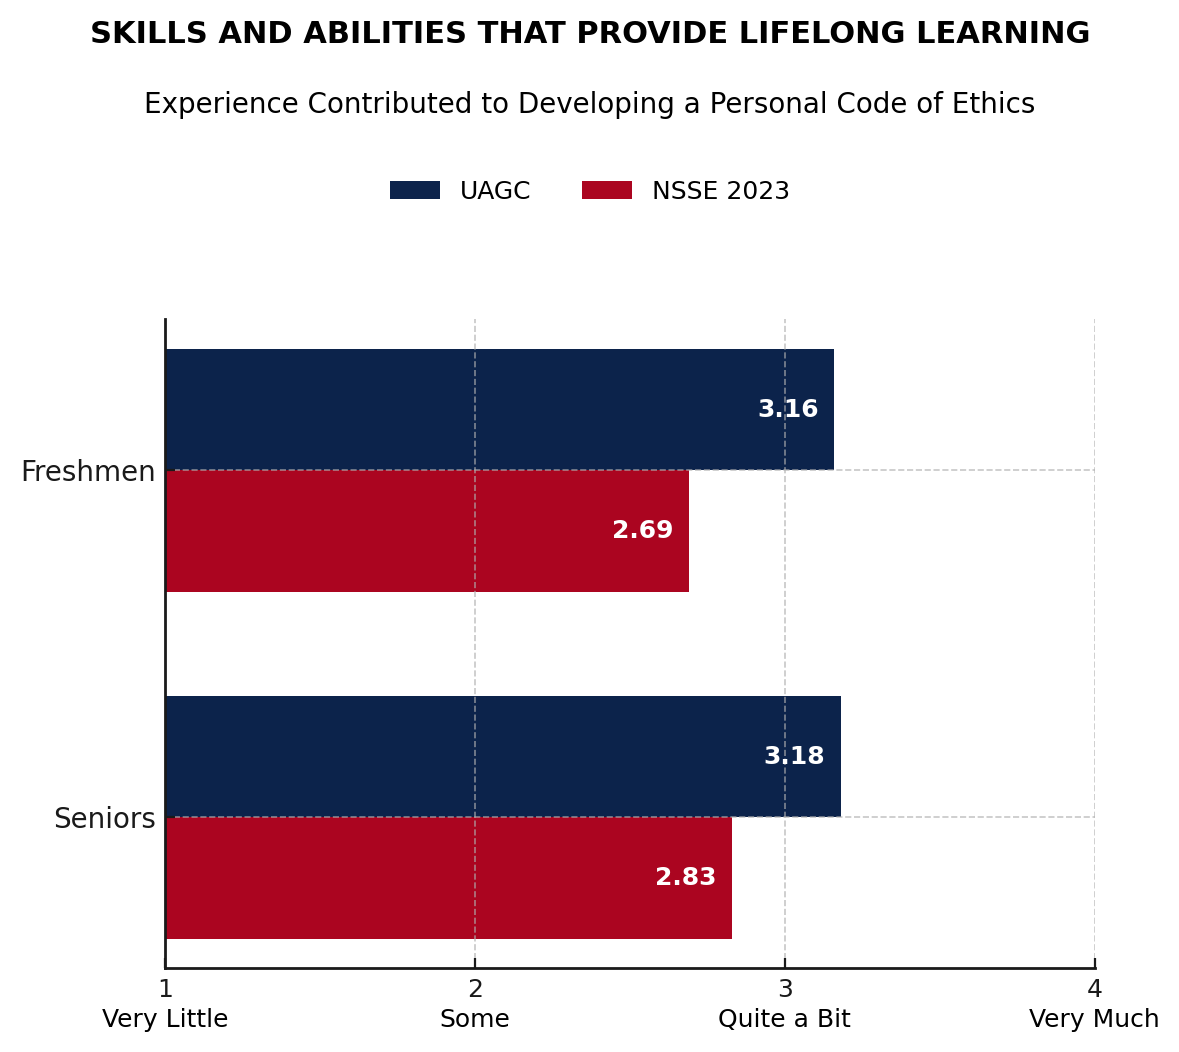
D. How much has your experience at this institution contributed to your knowledge, skills, and personal development in the following areas?
Scale: 1 = Very little, 2 = Some, 3 = Quite a bit, 4 = Very muchSource: Office of Institutional Effectiveness, 2023
NOTE: March-May 2023 survey of 8,106 University of Arizona Global Campus first-year (FY) and senior (SR) students (FY=3,405; SR=4,701). Sample size obtained: 1,535. Overall response rate: 19%. -
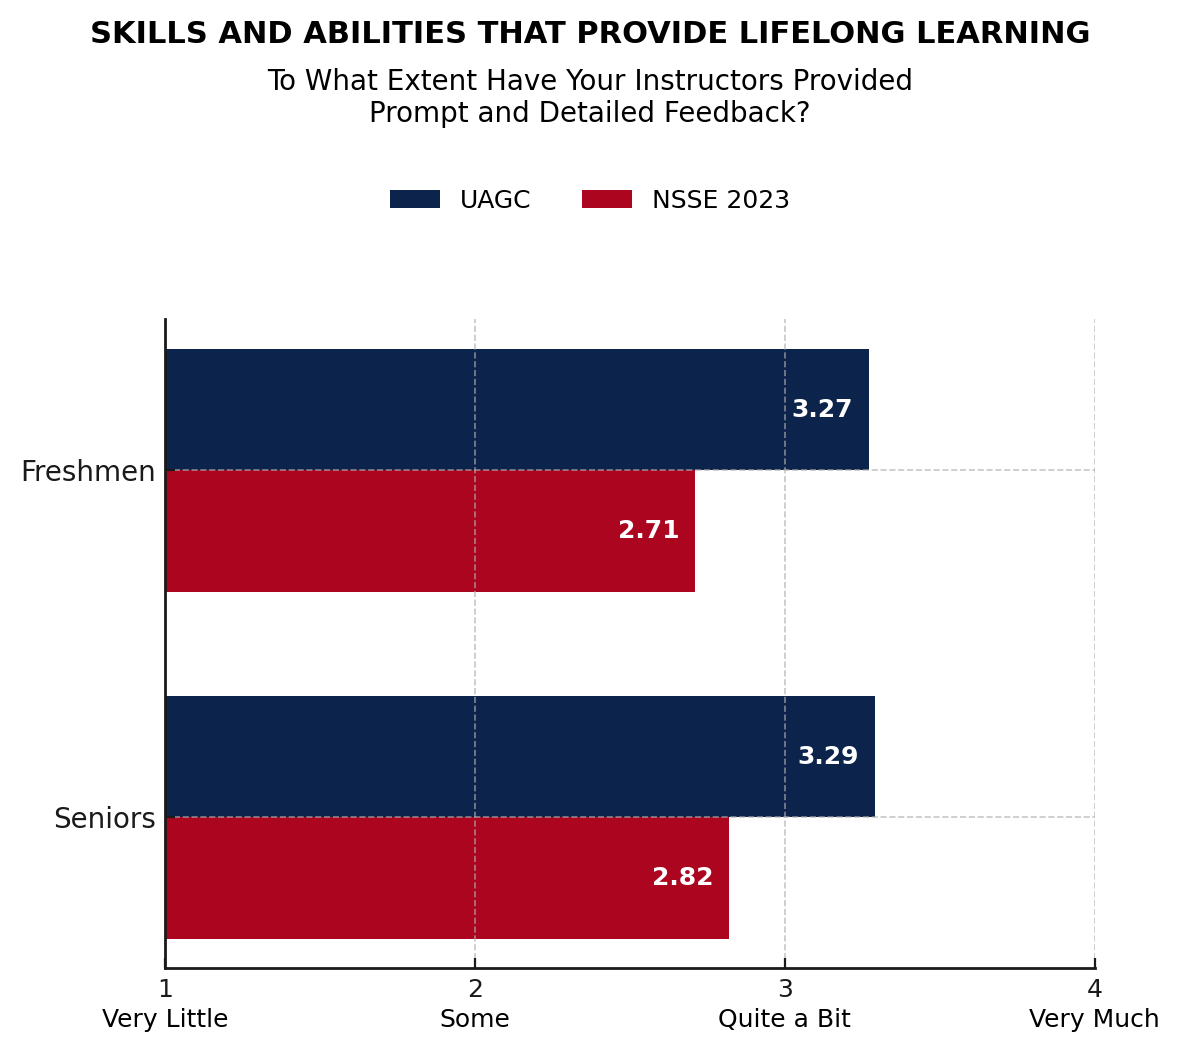
E. During the current school year, to what extent have your instructors done the following?
Scale: 1 = Very little, 2 = Some, 3 = Quite a bit, 4 = Very muchSource: Office of Institutional Effectiveness, 2023
NOTE: March-May 2023 survey of 8,106 University of Arizona Global Campus first-year (FY) and senior (SR) students (FY=3,405; SR=4,701). Sample size obtained: 1,535. Overall response rate: 19%. -
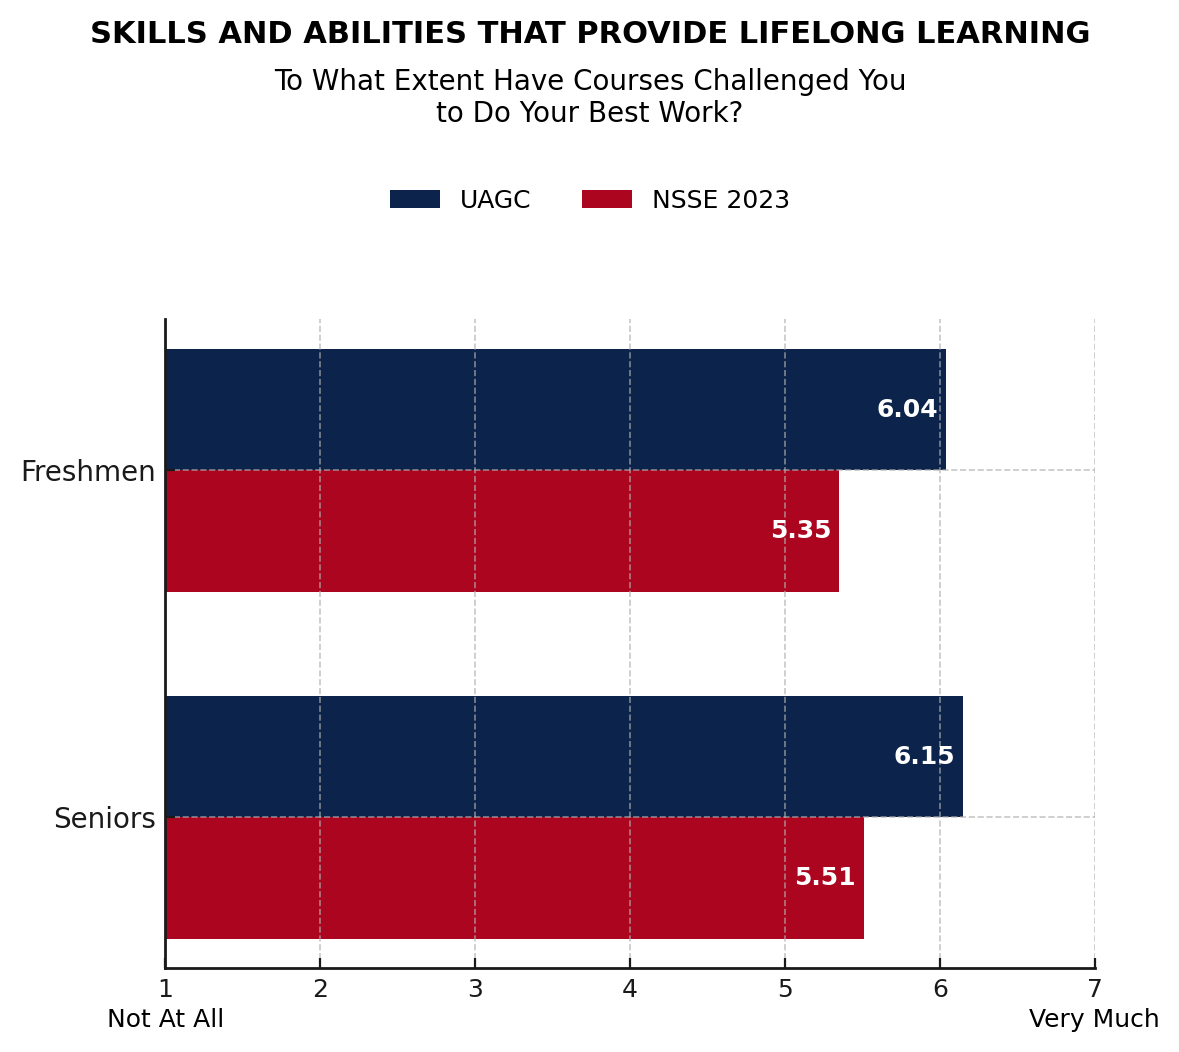
F. During the current school year, to what extent have your courses challenged you to do your best work?
Scale: 1 = Not at all, 7 = Very muchSource: Office of Institutional Effectiveness, 2023
NOTE: March-May 2023 survey of 8,106 University of Arizona Global Campus first-year (FY) and senior (SR) students (FY=3,405; SR=4,701). Sample size obtained: 1,535. Overall response rate: 19%.